Fetch.ai (FET/USD) on the Cusp of a Breakout: $1.00 Target Fuels Bullish Excitement
Estimated Reading Time: 3 minutes
Don’t invest unless you’re prepared to lose all the money you invest. This is a high-risk investment and you are unlikely to be protected if something goes wrong. Take 2 minutes to learn more
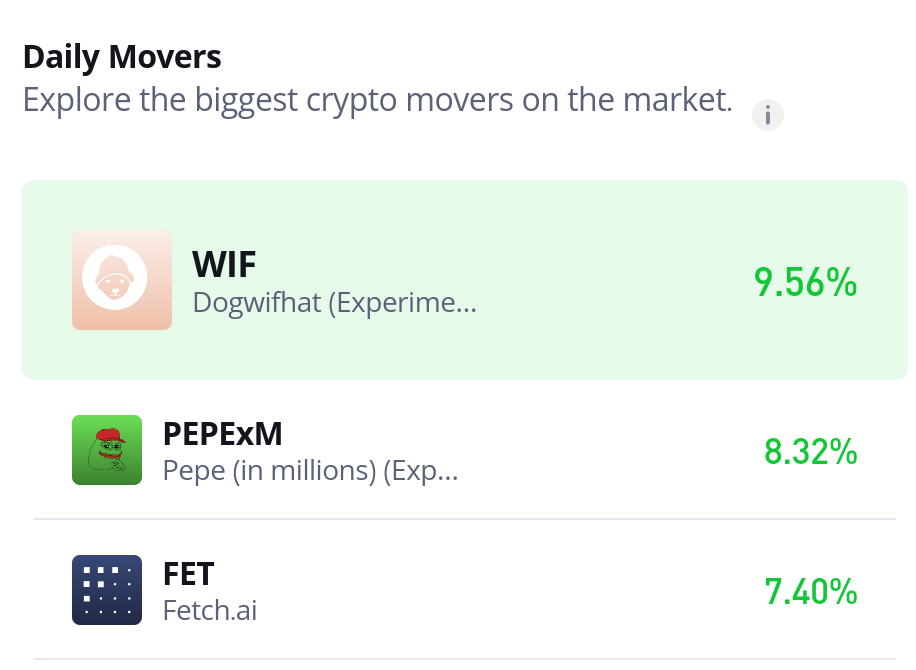
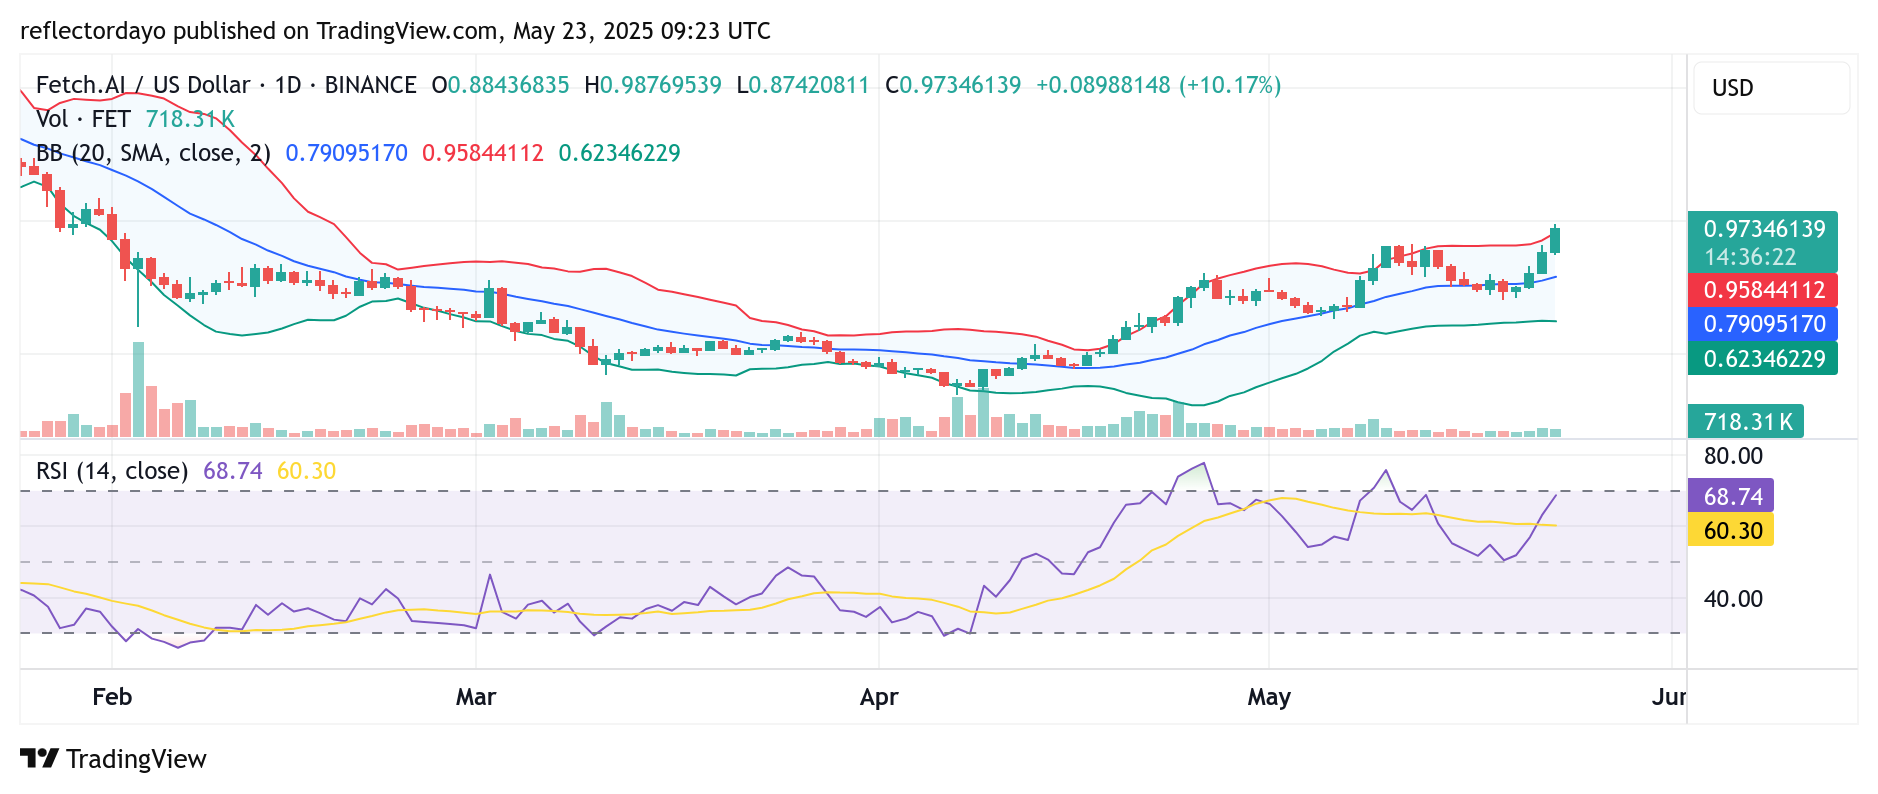
Fetch.ai (FET/USD) is currently exhibiting a steady upward trajectory, marked by a pattern of higher lows and slightly higher highs—an indication of growing bullish momentum. However, as the market inches closer to the critical psychological resistance at $1.00, trader sentiment appears to be turning cautiously optimistic.
On the daily chart, the price action suggests the early stages of a potential bullish breakout. Yet, the $1.00 mark stands as a significant test for this emerging trend. This level not only represents a major psychological barrier but also serves as a key technical checkpoint that could determine the credibility and sustainability of the ongoing uptrend.
If bulls succeed in breaching this resistance with strong volume, it could pave the way for a more pronounced rally. Until then, cautious trading behavior is likely to persist as market participants wait for confirmation.
Fetch.ai Market Data
- FET/USD Price Now: $0.98
- FET/USD Market Cap: $2.4 billion
- FET/USD Circulating Supply: 2.4 billion FET
- FET/USD Total Supply: 2.7 billion FET
- FET/USD CoinMarketCap Ranking: #48
Key Levels
- Resistance: $1.00, $1.10 and $1.20
- Support: $0.70, $0.650, and $0.65
Fetch.ai (FET/USD) Technical Outlook: Bullish Momentum Faces Test Near $1.00 Resistance
The Relative Strength Index (RSI) currently hovers around 69, indicating that Fetch.ai (FET/USD) is approaching overbought territory. As the RSI nears the 70 threshold, traders may begin to anticipate a short-term correction. Evidence of this caution is already emerging, with a visible upper wick forming on the latest bullish candlestick—an early sign of profit-taking among market participants.
Despite this potential pullback, overall market sentiment remains cautiously optimistic. The prevailing bullish pressure suggests that FET/USD may hold steady around the $1.00 psychological level, even as conflicting sentiments introduce a brief consolidation phase.
Looking ahead, if the uptrend continues with moderate strength, FET could target the $1.50 to $3.00 range in the near future. However, this outlook remains conditional. External risks—such as an economic downturn or unfavorable regulatory developments—could drag prices below the $0.50 support level.

FET/USD 4-Hour Chart: Bullish Momentum Builds with Strong Volume, but $1.00 May Trigger Consolidation
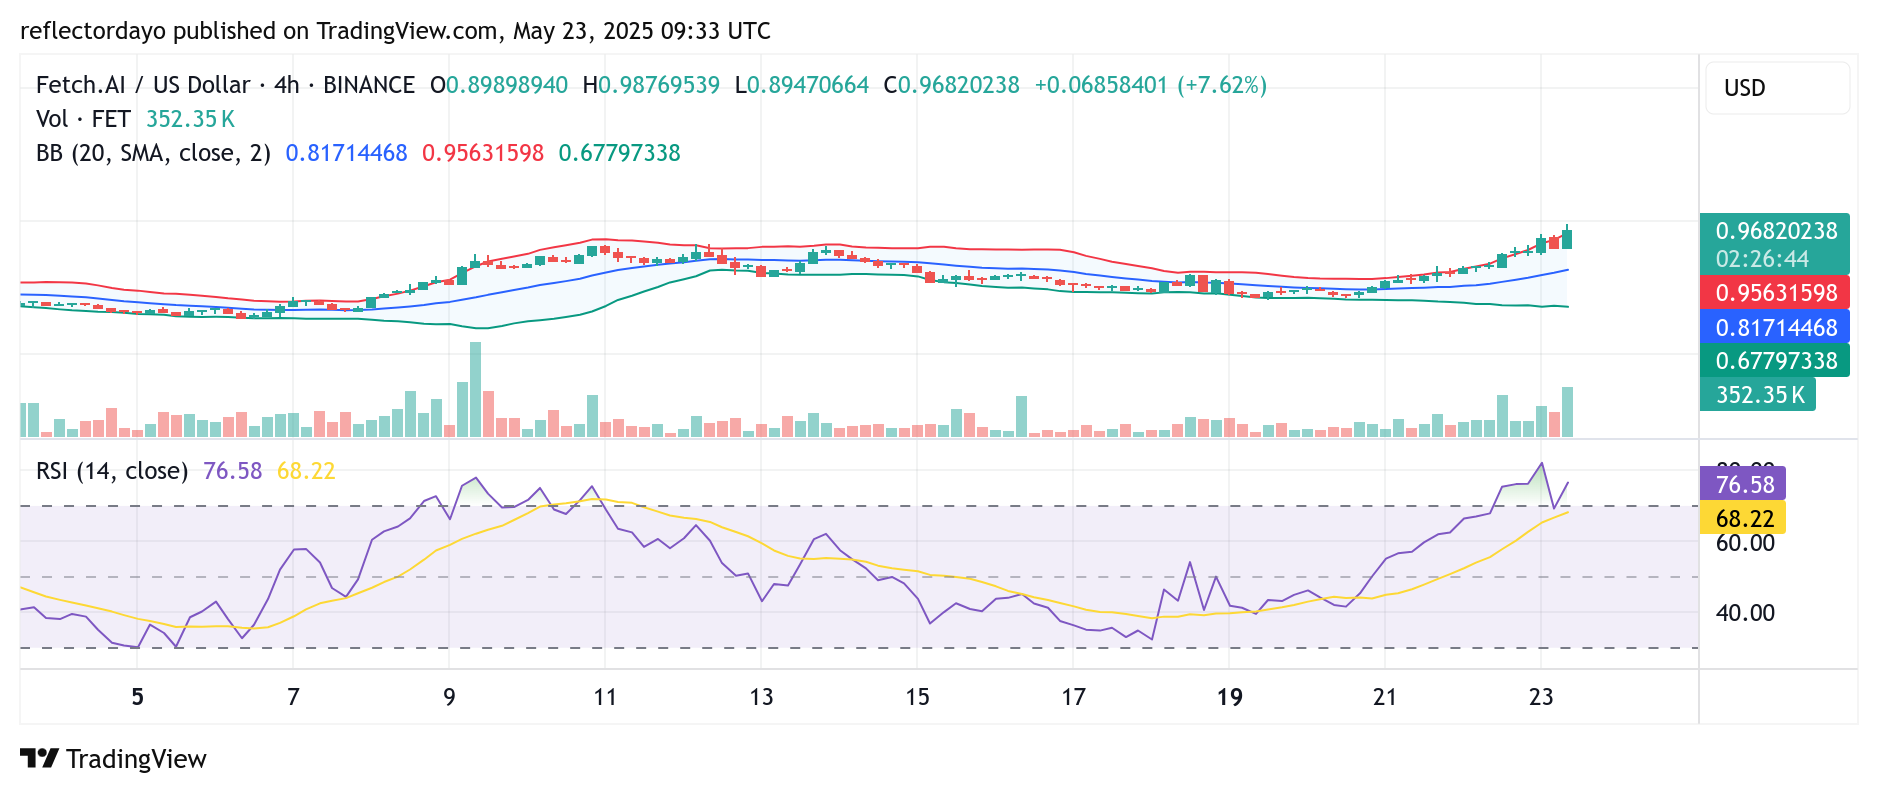
From the 4-hour chart perspective, market action reaffirms the broader bullish sentiment seen on the daily chart. Fetch.ai (FET/USD) has gained upward traction significantly, supported by a corresponding increase in trading volume—adding credibility to the current rally.
While the steady and progressive trend suggests potential for continued growth in the near term, traders should remain cautious as the price approaches the key psychological resistance at $1.00. This level may act as a consolidation zone, where a clash of bullish and bearish biases could briefly stall the uptrend.
Monitoring market behavior around this threshold will be crucial in anticipating the next significant move.