Polkadot Stabilizes above the $5.18 Support for a Possible Rebound
Estimated Reading Time: 2 minutes
Don’t invest unless you’re prepared to lose all the money you invest. This is a high-risk investment and you are unlikely to be protected if something goes wrong. Take 2 minutes to learn more
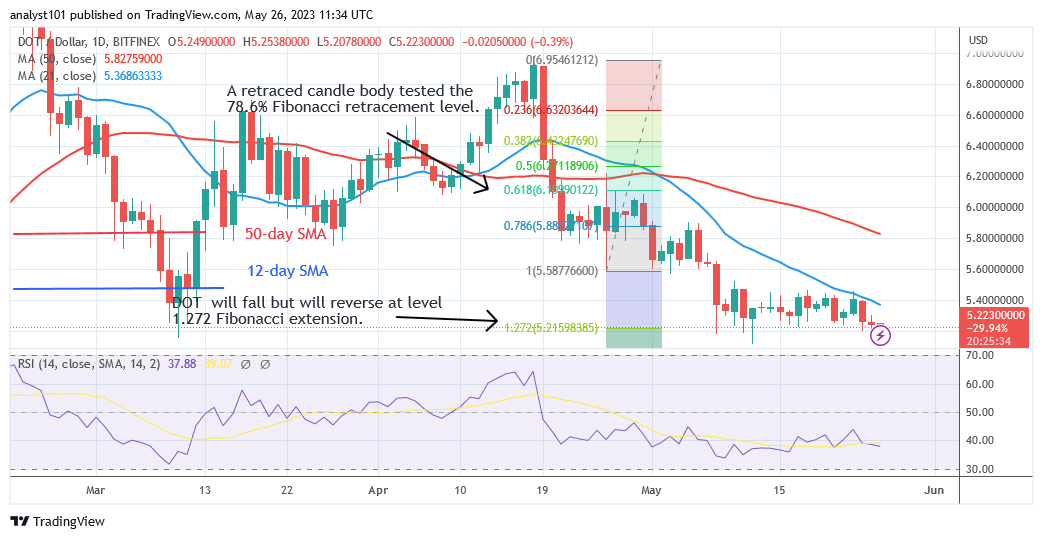
Polkadot (DOT) Long-Term Analysis: Bearish
Polkadot (DOT) has been trading above the $5.18 level of support for a possible rebound. The bearish trend has decreased since the price decline on May 8. The price indication suggested that there might be a decrease and reversal in the DOT price. For the preceding two weeks, the DOT price has been trading above the $5.18 support but below the $5.40 resistance. The increasing movement has been halted by the 21-day SMA. At the $5.21 price level, which corresponds to the level of the 1.272 Fibonacci extension, the price signal has indicated that the downward trend will reverse.
Technical indicators:
Major Resistance Levels – $10, $12, $14
Major Support Levels – $8, $6, $4
Polkadot (DOT) Indicator Analysis
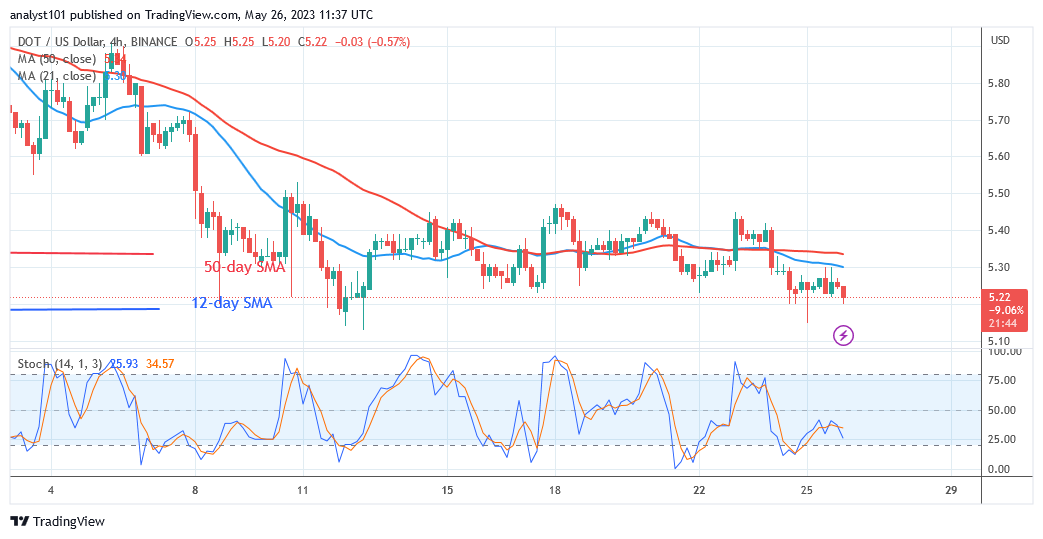
On the Relative Strength Index for period 14, Polkadot is at level 38. It has bearish exhaustion and is currently in the decline zone. The fall has been caused by the price bars being below the moving average lines. Polkadot is below the daily Stochastic’s level 50 and experiencing negative momentum.
What Is the Next Direction for Polkadot (DOT)?
The DOT/USD is still stabilizing above the $5.18 support for a possible rebound. The price movement is dominated by little, unsure candles. The candlesticks have caused the market to be range-bound. The current consolidation will either cause Polkadot’s price to increase or decrease.
You can purchase Lucky Block here. Buy LBLOCK
Note: Cryptosignals.org is not a 1a financial advisor. Do your research before investing your funds in any financial asset or presented product or event. We are not responsible for your investing results