Bitcoin (BTC/USD) Price Surges Closely to $42,500 Resistance
Estimated Reading Time: 3 minutes
Don’t invest unless you’re prepared to lose all the money you invest. This is a high-risk investment and you are unlikely to be protected if something goes wrong. Take 2 minutes to learn more

Free Crypto Signals Channel
Bitcoin Price Prediction – March 20
Lately, the BTC/USD market suffered a drawdown in its market valuation to locate the support of around $37,500. The crypto business price surges closely to the $42,500 resistance point a couple of hours back. The market has achieved a high of $42,332 as it now trades around $41,481, keeping a percentage of 1.81 negatives.
BTC/USD Market
Key Levels
Resistance levels: $42,500, $45,000, $47,500
Support levels: $37,500, $35,000, $32,500
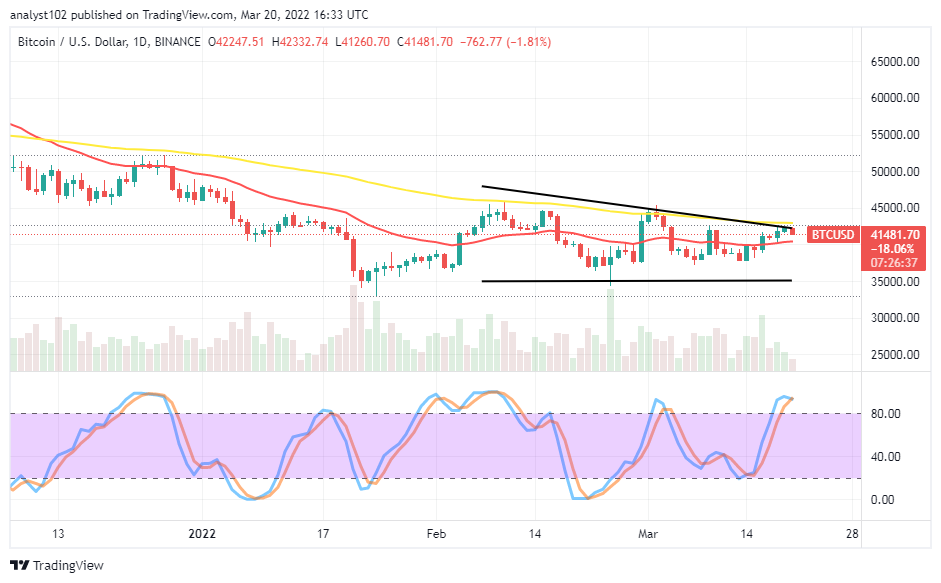
BTC/USD – Daily Chart
The BTC/USD daily chart exhibits the crypto-economic price surges closely to the $42,500 resistance level. The critical support baseline remains intently drawn at $35,000. The bearish trend line drew southwardly to touch some points to the downside to form a descending triangular pattern of the market’s trading outlook. The 50-day SMA indicator is almost at higher points alongside the bearish trend line above the 14-day SMA indicator. The Stochastic Oscillators are in the overbought region, seemingly attempting to cross their lines southbound within. That portends the forces to the upside are gradually losing the catalysts.
Will the BTC/USD market bulls push past the $42,500 as the crypto-economic price surges closely to the value-line?
The current trading capacity outlook of the BTC/USD trade doesn’t seem to get sustainable pushes from bulls as the crypto-economic price surges closely to the $42,500 resistance level. At this material trading point, some upward moves attempted around the value-line will most likely turn to active reversal motion to get decent sell entries. Therefore, long-position takers should be careful of launching more positions even if a sudden spike eventually emerges around the point.
On the downside of the technical analysis, all seems to be getting set for the short-position takers to brace up for spotting any sell sign emanating from rejections of price movements around the $42,500 resistance trading zone to have the advantage of it to launch a position. As a bearish candlestick appears, forming on a gradual mode, it means the pressures to the north side have been lessening. To get a clearer picture of the situation, both the 1-hour and 4-hour charts may use for determining or considering a sell entry.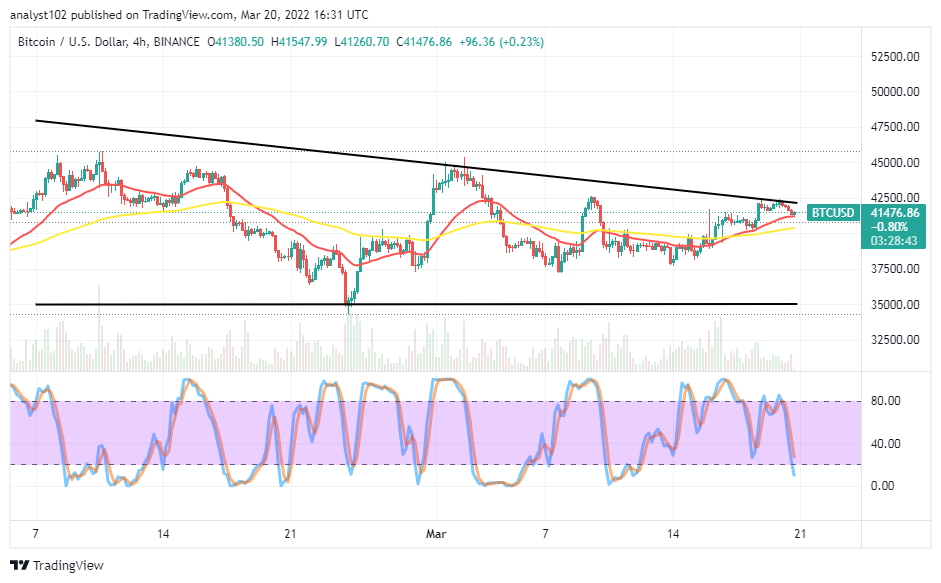
BTC/USD 4-hour Chart
The BTC/USD medium-term chart reveals the crypto-economic price surges closely to the $42,500 resistance level. The bearish trend line drew to touch the resistance spot above the SMAs. The 14-day SMA indicator has briefly intercepted the 50-day SMA indicator from beneath. The Stochastic Oscillators have moved southbound into the oversold region. And, yet, they are pointing to the downside within it. A fearful rebound against the bearish trend line at the value-line mentioned will propel the market on the journey to revisit a higher resistance level of around $45,000 in the long-term run.
Note: Cryptosignals.org is not a financial advisor. Do your research before investing your funds in any financial asset or presented product or event. We are not responsible for your investing results.
You can purchase Lucky Block here. Buy LBlock: