Polkadot Ascents as It Reaches the $5.22 Low
Estimated Reading Time: 3 minutes
Don’t invest unless you’re prepared to lose all the money you invest. This is a high-risk investment and you are unlikely to be protected if something goes wrong. Take 2 minutes to learn more
Polkadot (DOT) Long-Term Analysis: Bearish
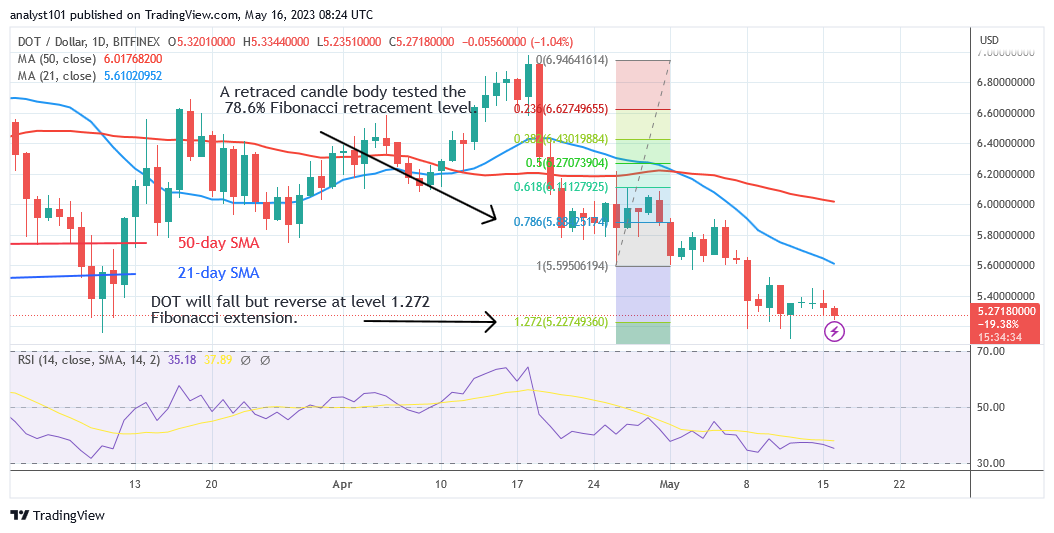
Polkadot (DOT) price is rising as it reaches the $5.22 low. As the altcoin consolidates above the current level, the bearish trend has abated for the week. The bearish momentum has waned as the alternative currency reverts to its lowest price point. The price of the cryptocurrency at the time of writing is $5.27. A potential decrease and eventual reversal have been suggested by the price signal. The DOT price had an upward adjustment during the April 26 downturn, and a candle body tested the 78.6% Fibonacci retracement level. The correction suggests that DOT will decline but then turn around at the level of the 1.272 Fibonacci extension, or $5.22. According to the price movement, the DOT price has started its ascent after retesting the Fibonacci extension level of 1.272.
Polkadot (DOT) Indicator Analysis
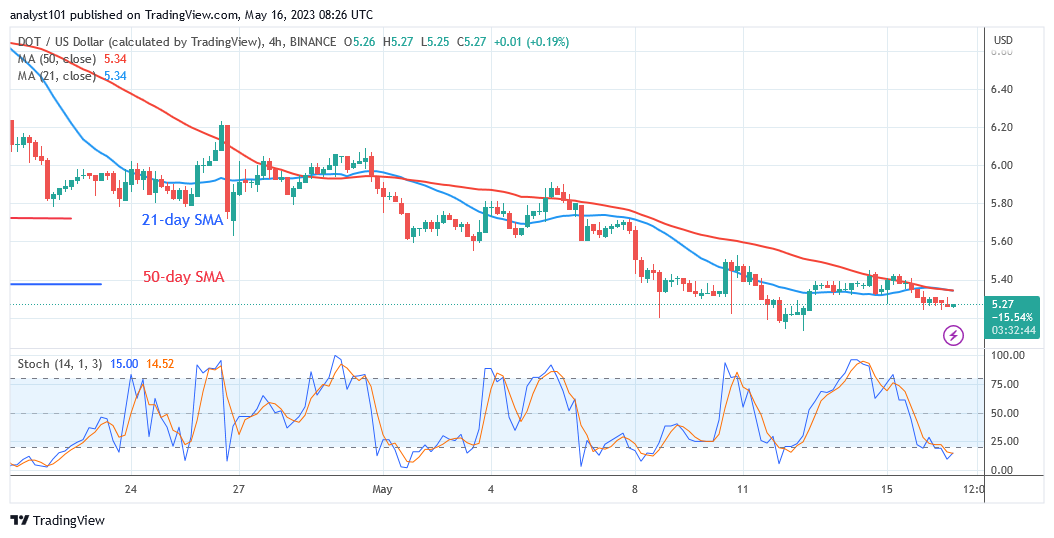
Polkadot is at level 35 on the Relative Strength Index for period 14. Due to the lack of price movement, the RSI has remained constant. There is a further downward movement because the price bars are below the moving average lines. Polkadot has reached the point where the market is oversold. The daily Stochastic is below level 20 at this time. Bearish weariness has been achieved with the selling pressure.
Technical indicators:
Major Resistance Levels – $10, $12, $14
Major Support Levels – $8, $6, $4
What Is the Next Direction for Polkadot (DOT)?
The oversold area of the market for DOT/USD has reached as it reaches the $5.22 low. The alternative currency has sunk to its previous low of $5.15. Additionally, the historical price level of March 10 is being retested. The price indicator predicts that Polkadot will turn around when the market reaches the oversold area at a level of $5.22.
You can purchase Lucky Block here. Buy LBLOCK
Note: Cryptosignals.org is not a 1a financial advisor. Do your research before investing your funds in any financial asset or presented product or event. We are not responsible for your investing results