Polkadot Holds above $5.15 Support as It Restarts Its Upward Trend
Estimated Reading Time: 2 minutes
Don’t invest unless you’re prepared to lose all the money you invest. This is a high-risk investment and you are unlikely to be protected if something goes wrong. Take 2 minutes to learn more
Polkadot (DOT) Long-Term Analysis: Bearish
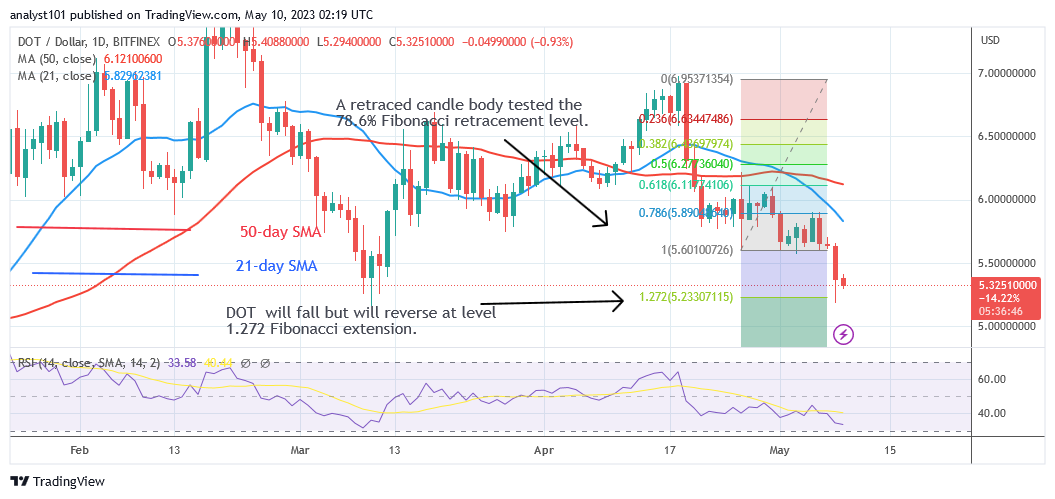
Polkadot (DOT) is now trading at a lower price as it restarts its upward trend. The selling pressure began when the DOT price found resistance at the $7.00 level. The bearish momentum broke through the moving average lines. Later, a correction upward in the DOT price occurred, but it was stopped by resistance at the $6.00 level. The rejection at the $6.00 high ended the bearish downward spiral. A negative is that the DOT price has dropped to a low of $5.18. This is the historical pricing level as of March 10. The cryptocurrency will regain bullish momentum once it holds above the $5.00 support. After rising beyond recent resistance in March, the cryptocurrency began its ascent.
Technical indicators:
Major Resistance Levels – $10, $12, $14
Major Support Levels – $8, $6, $4
Polkadot (DOT) Indicator Analysis
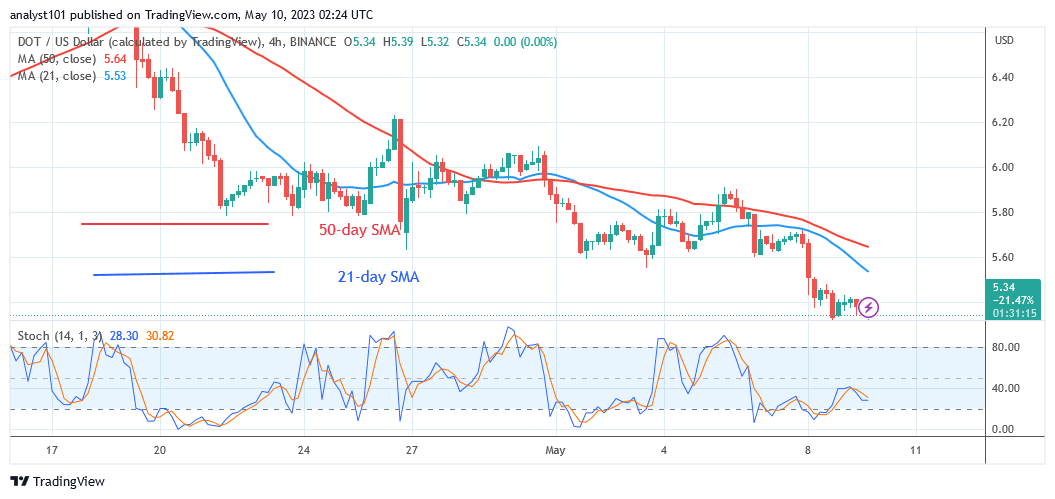
Polkadot is at level 34 on the Relative Strength Index for period 14. In the bearish trend zone, the altcoin will continue to decrease. The price bars are pointing downward and are below the moving average lines. When the daily Stochastic is below level 40, the cryptocurrency is in a bearish momentum.
What Is the Next Direction for Polkadot (DOT)?
The Polkadot slide ended as soon as the cryptocurrency rose over its previous low of $5.15. The cryptocurrency asset will restart its upward trend if the existing support persists. The cryptocurrency is currently re-testing the historical price level in anticipation of a bullish trend.
You can purchase Lucky Block here. Buy LBLOCK
Note: Cryptosignals.org is not a 1a financial advisor. Do your research before investing your funds in any financial asset or presented product or event. We are not responsible for your investing results