Bitcoin Cash (BCH/USD) Market Lowers at the Mid-Range Point at $600
Estimated Reading Time: 3 minutes
Don’t invest unless you’re prepared to lose all the money you invest. This is a high-risk investment and you are unlikely to be protected if something goes wrong. Take 2 minutes to learn more
Bitcoin Cash Price Prediction – November 19
The BCH/USD market lowers at the mid-range point at $600 as the crypto-economic price trades $577 currently. The crypto trade pushes at a positive percentage rate of about 4.18, showcasing that price is in a recovery movement.
BCH/USD Market
Key Levels:
Resistance levels: $700, $800, $900
Support levels: $500, $400, $300
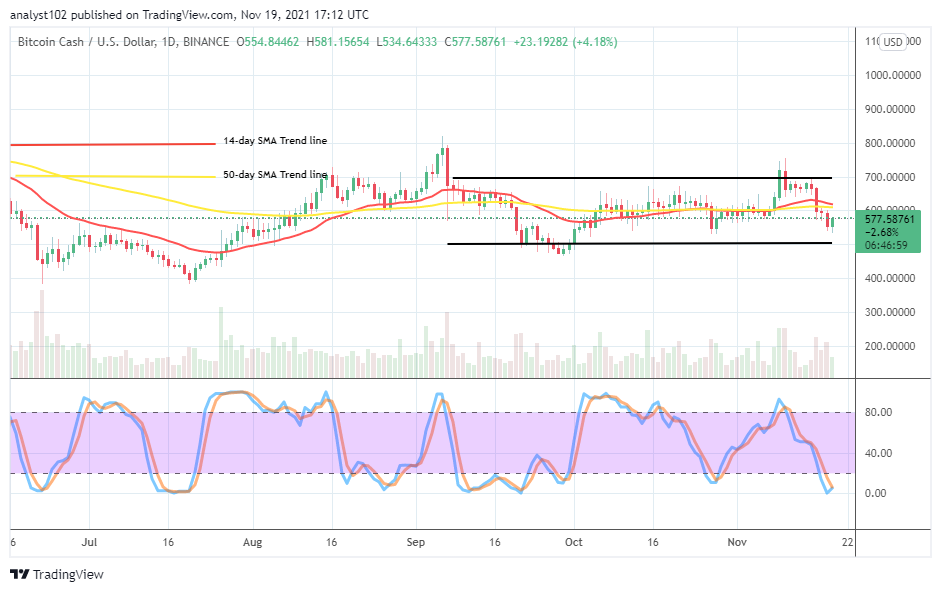
BCH/USD – Daily Chart
The BCH/USD daily chart exhibits that the crypto market lowers at the mid-range point at $600, having the $700 and $500 levels as the upper and the lower range levels respectively to define the actual range trading zones over some sessions back. The 14-day SMA trend line has separated faintly above the 50-day SMA trend line in the range-bound spots. The Stochastic Oscillators have dipped into the oversold region, trying to close the lines at the range of zero. That could mean that the crypto trading instrument may soon get re-positioned for upswings making from a lower line in the near days’ sessions.
Has there been a clear indication the BCH/USD trade buyers should get set to exert positions as the market lowers at the mid-range point at $600?
There has been a fresh clue into the indication that the BCH/USD trade buyers may have to get set for long position entries in the near time as the crypto market lowers at the mid-range point at the $600 level. A bullish trading candlestick is currently in the making, averages the mid-range value line. And, that suggests that some buying intrigues have started resulting back in the business operations on a gradual moving motion.
On the downside of the technical analysis, if the current slow-moving pace of the market strongly resisted around the mid-range value line at $600, the eventual downing motion will be to re-visit its lower range trading spot in the long run. On the contrary, it is still firmly portended by the reading of the Stochastic Oscillators that some subsequent motions may for long be in the responses to the upside. Therefore, sellers needed to be cautious of their repositioning stances in the market operations between BCH and the USD. 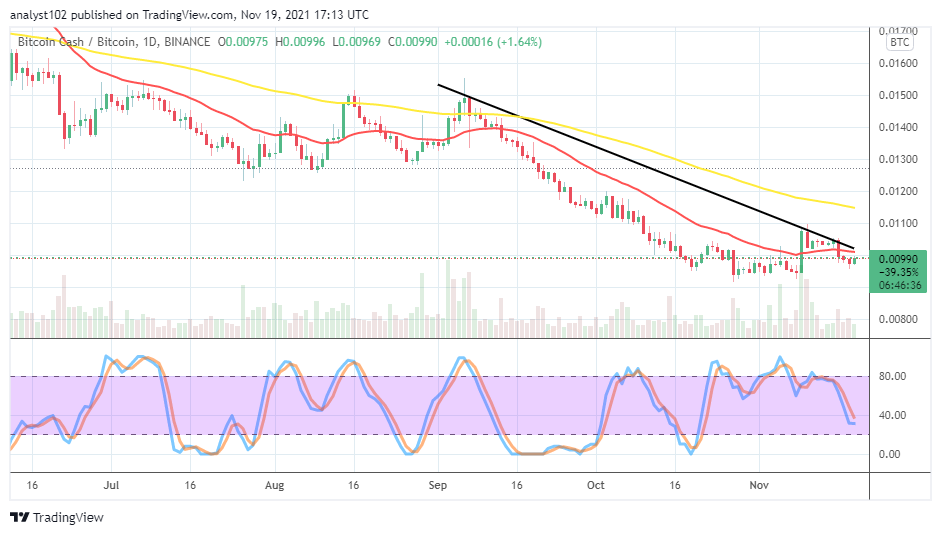
BCH/BTC Price Analysis
In comparison, the trending capacity of Bitcoin Cash and Bitcoin, the daily price chart shows that the cryptocurrency pair market lowers around the smaller SMA trend line. The 50-day SMA indicator is above the 14-day SMA indicator. The Stochastic Oscillators are down at the range of 40, attempting to close the lines a bit beneath it. That signifies that the base crypto’s pushing ability is reaching the support level to rebuild its energy as paired with the flagship counter crypto.
Note: Cryptosignals.org is not a financial advisor. Do your research before investing your funds in any financial asset or presented product or event. We are not responsible for your investing results.
You can purchase crypto coins here. Buy Tokens