Litecoin (LTC/USD) Trade Stagnates, Wallowing in Ranges
Estimated Reading Time: 3 minutes
Don’t invest unless you’re prepared to lose all the money you invest. This is a high-risk investment and you are unlikely to be protected if something goes wrong. Take 2 minutes to learn more
Litecoin Price Prediction – August 29
About two weeks ago, the worthiness of the Litecoin trade had been stagnating closely above the support line of $60, as the transaction activities are wallowing in ranges characterized by lower lows.
As long as the price stays between $65.734538 and $65.050035 at a percentage rate of 0.62 negative, many gravities have been reasonably depleted. Due to the technicality, bulls might yet attempt a session of downholding that might perhaps border around the $60 support line before regaining strong energy to nudge into a bullish route.
LTC/USD Market
Key Levels:
Resistance levels: $80, $90, $100
Support levels:$60, $55, $50
LTC/USD – Daily Chart
The LTC/USD daily chart portrays the crypto-economic trade stagnating near the support level of $60 from the topside, wallowing in range formation.
The 14-day SMA indicator’s value of $72.931172 is above the 50-day SMA indicator’s value of $83.142811. With a careless sign, the stochastic oscillators have moved northward from the oversold area. Every sign points to less active movements emerging to thwart any potential abrupt upsurges.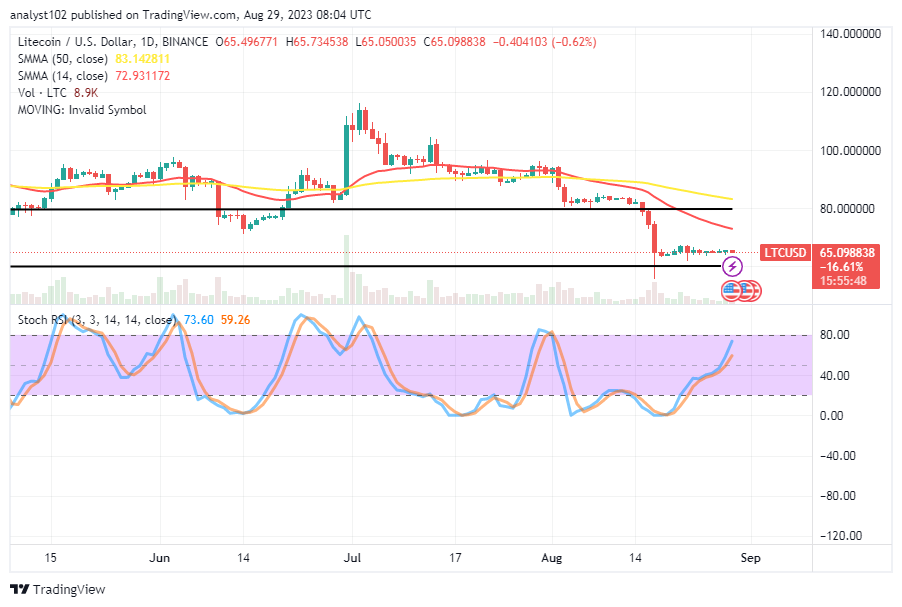
Is there an obvious entry point to start a position in the present LTC/USD trade setup?
There is no visible and reliable entry in the present transaction arrangement in the LTC/USD market operation, given that cryptocurrency trade stagnates, wallowing in ranges.
In the wake of bidding for a recovery movement, long-position pushers have to progressively pull up muscles around the support level of $60. Even at this period, considering the lower trading zone, buyers needed to commence launching buying position orders.
A draw-up must surface to touch the 14-day Moving Average level in order to be considered a fair and probable situation for receiving a shorting entry order point. Before shorting an order, the expected circumstance can pay attention to a line of rejection signals to make sure it is eligible. However, in order to avoid a delayed execution, they will need to be warned of the need to act quickly.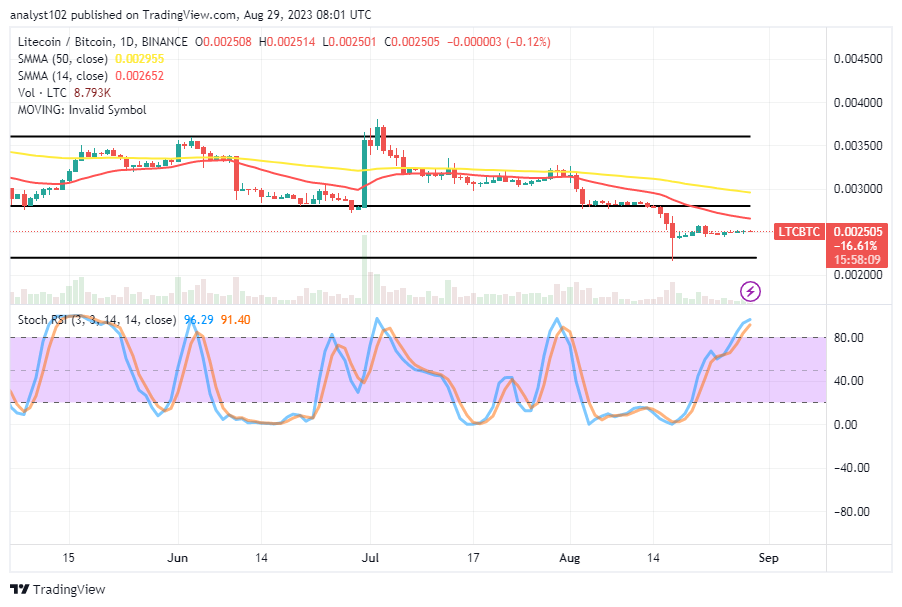
LTC/BTC Price Analysis
In contrast, the purchasing mood of Litecoin stagnates against the trending ability of Bitcoin, displaying that the prices are wallowing in ranges beneath the trend lines of the moving averages.
The 50-day SMA indicator has been placed below the 14-day SMA indicator in a southerly direction to support the idea that surges upward will encounter resistance before further gains. The Stochastic Oscillators are now located between 91.40 and 96.29, extending their reach towards the overbought area. Restoring the oscillators to their lower positions will give rise to the trait of reviving the expectation of the base trading instrument leaping against the counter-currency.
Note: Cryptosignals.org is not a financial advisor. Do your research before investing your funds in any financial asset or presented product or event. We are not responsible for your investing results.
You can purchase Lucky Block here. Buy LBLOCK