Bitcoin (BTC) Price Prediction: BTC/USDT Stays Vulnerable
Estimated Reading Time: 3 minutes
Don’t invest unless you’re prepared to lose all the money you invest. This is a high-risk investment and you are unlikely to be protected if something goes wrong. Take 2 minutes to learn more

Date: August 27, 2025
The Bitcoin market has recently witnessed a steep decline. Since that fall, price action has struggled to gather enough momentum to break free from the prevailing bearish gravitational pull in the market. Let’s take a closer look at how conditions are shaping up.
BTC/USDT Long-Term Trend — Bullish (Daily Chart)
Key Price Levels
Resistance: $113,000, $116,500, $119,000
Support: $110,000, $107,500, $105,000
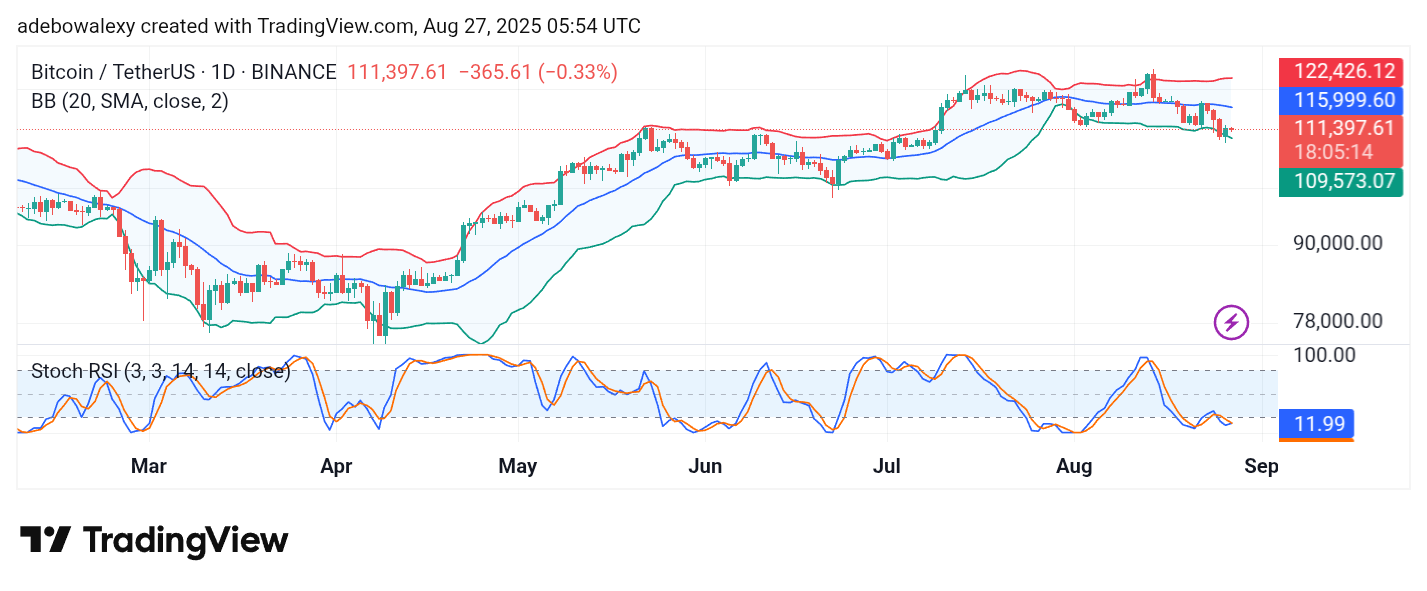
The previous session in the Bitcoin market delivered a moderate recovery, which pushed the token to trade slightly above the lower band of the Bollinger Bands (BB) indicator. However, the ongoing session has kept the token trading just along the lower band of the BB indicator. At the same time, the Stochastic Relative Strength Index (SRSI) lines are currently crossing over within the oversold region, pointing to a struggle between market forces at this level.
Bitcoin Price Prediction: BTC/USDT Bulls Are Under Suppression
Price action in the Bitcoin daily chart peaked on August 13, reaching a new all-time high before spiraling downward in what appeared to be a selloff frenzy. This sharp move forced the market to breach the \$115,000 support. At present, the token remains below the middle band of the BB indicator.
The ongoing session continues to highlight strong bearish pressure weighing on buyers, a development that could easily cut short bullish expectations. Nevertheless, the lines of the SRSI are converging in the oversold region, indicating that traders may need to wait for stronger confirmation signals before considering bullish positions.
Bitcoin Price Prediction: BTC/USDT Yields to Bearish Pressure (4-Hour Chart)
On the 4-hour Bitcoin chart, signs are emerging that upside forces are weakening. The last two price candles are red and appear to present a smooth downward rebound from the middle band of the BB indicator. Likewise, the BB indicator itself is showing a slight downward slope, reflecting weakening momentum.
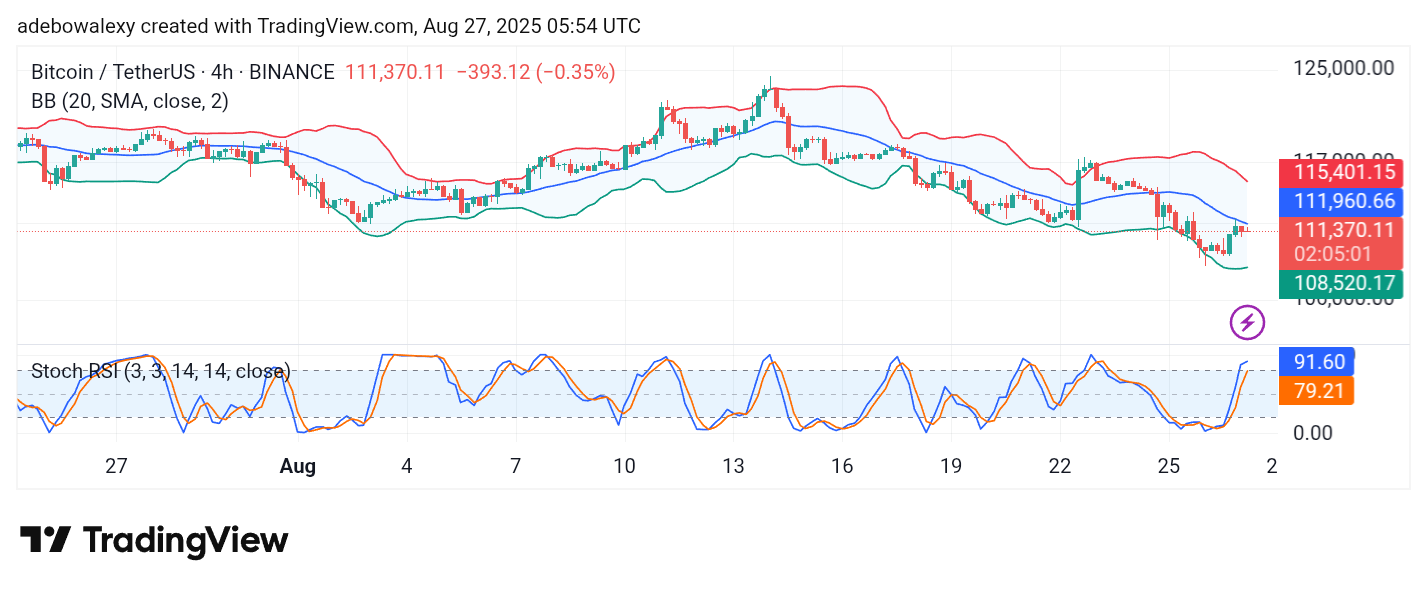
Meanwhile, the SRSI lines have risen notably into the overbought region but are now curving downward, signaling the start of a pullback. This behavior in the SRSI indicator reinforces the bearish outlook and suggests that price action could retreat further toward the $110,000 support level.