Bitcoin (BTC) Price Prediction: BTC/USDT Dips Sharply, Creating a Low Entry Point
Estimated Reading Time: 3 minutes
Don’t invest unless you’re prepared to lose all the money you invest. This is a high-risk investment and you are unlikely to be protected if something goes wrong. Take 2 minutes to learn more

Date: August 20, 2025
The Bitcoin market has experienced a significant price decline. This development has shaken the general crypto market as well, causing most coins to plummet. However, a modest rebound has occurred, which may attract more investors at this point.
BTC/USDT Long-Term Trend — Bullish (Daily Chart)
Key Price Levels:
Resistance: $115,000, $120,500, $125,000
Support: $113,000, $110,500, $105,000
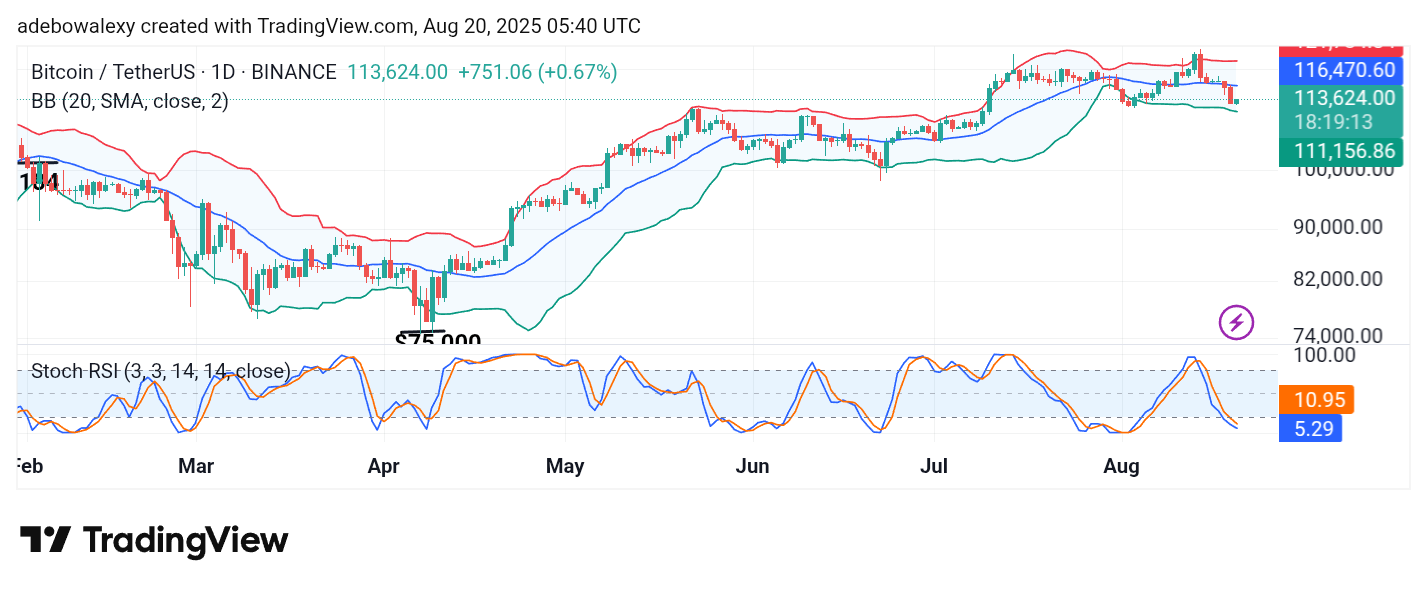
On the daily chart, the BTC/USDT market has witnessed a moderate upward rebound from the $113,000 price level in the ongoing session. Nevertheless, price action remains below the middle band of the Bollinger Bands (BB) indicator. Meanwhile, the Stochastic Relative Strength Index (SRSI) indicator lines continue a steady descent into the oversold region, without showing any signs of an upward crossover yet.
Bitcoin Price Prediction: BTC/USDT Upside Bounce Too Minimal
The Bitcoin market saw a sharp price decline in the previous session, which pushed prices close to breaching the $113,000 support level. However, buyers now appear more confident, stepping in to buy the dip.
As a result, the ongoing session is represented by a small green candle. Still, bullish momentum remains subdued, as price action stays below the middle band of the BB indicator. Additionally, the SRSI indicator lines continue descending into the oversold region without reversal.
Bitcoin Price Prediction: BTC/USDT Minimal Bullish Advances Hold Steady (4-Hour Chart)
Price action on the 4-hour chart shows that bullish forces are attempting to stabilize the market. The previous session registered a rebound off the lower band of the BB indicator, and the current session has sustained this movement, pushing the market slightly higher.
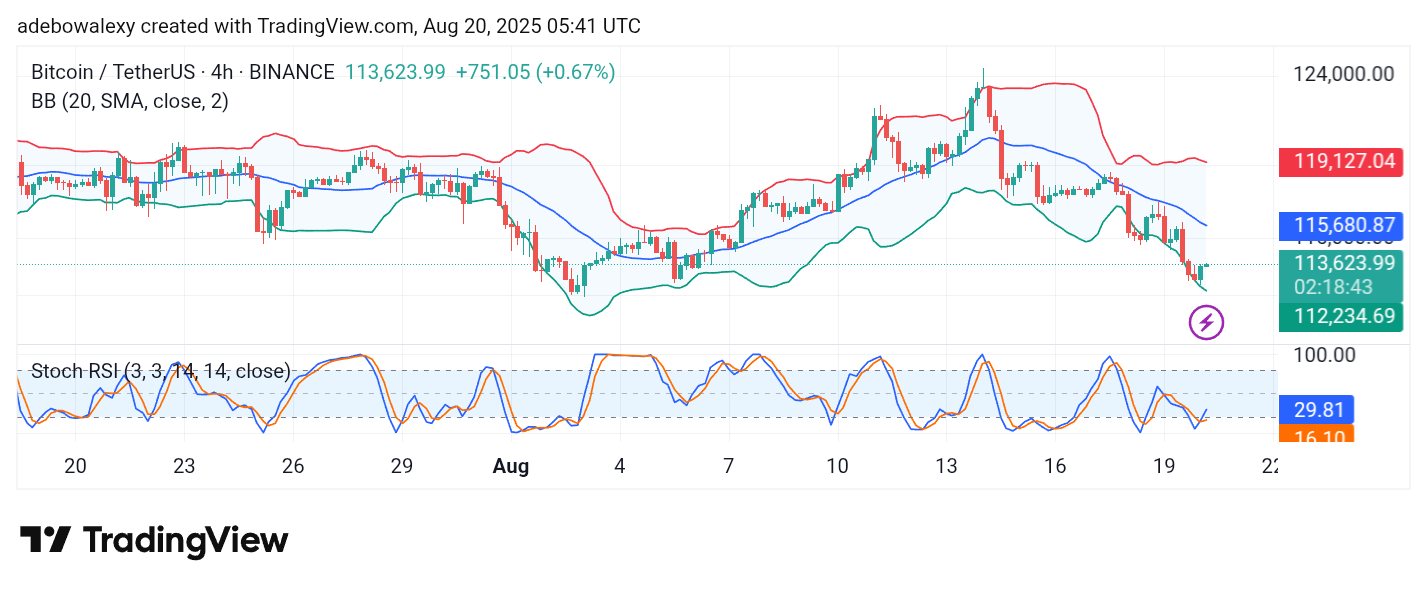
Similarly, the SRSI indicator lines have delivered an upward crossover in the oversold region, with both lines now trending higher.
However, the market still trades below the middle band of the BB indicator. While this suggests limited bullish momentum for now, the trend may strengthen in the near term. Traders can target $115,500 for short-term gains, with potential for higher levels if bullish momentum continues.