Lucky Block (LBLOCK/USD) Market Shows Bullish Momentum With Key Resistance in Sight
Estimated Reading Time: 3 minutes
Don’t invest unless you’re prepared to lose all the money you invest. This is a high-risk investment and you are unlikely to be protected if something goes wrong. Take 2 minutes to learn more

Lucky Block Price Forecast – February 24
The Lucky Block market shows bullish momentum with key resistance in sight. The ongoing correction is likely to end at $0.00001440.
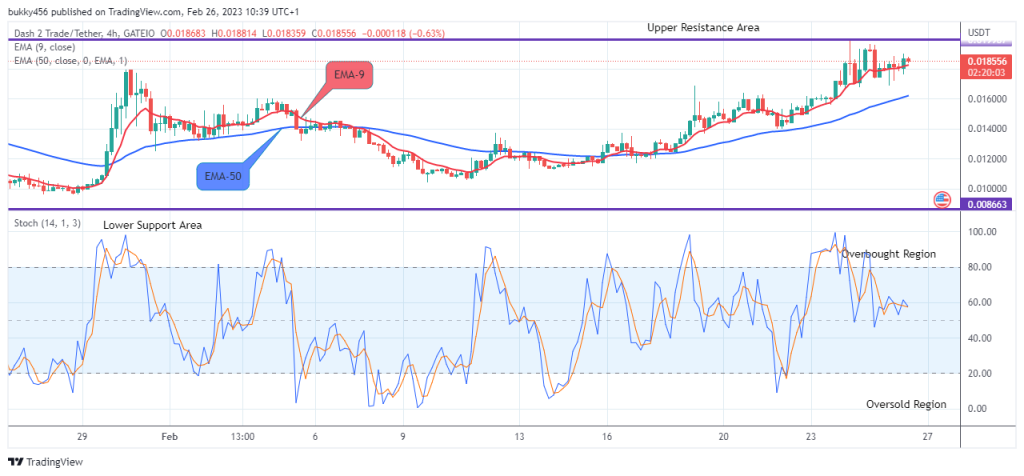
The MACD (Moving Average Convergence Divergence) indicator at the bottom of the chart confirms growing bullish momentum. The MACD line is crossing above the signal line and increasing green histogram bars. This signals potential upward movement as buying pressure builds. Additionally, the SMA (Simple Moving Average) is trending slightly upward, reinforcing the short-term bullish bias. The price is currently trading near this moving average, suggesting support at this level and potential continuation of the trend.
LBLOCK/USD Market Key Levels:
Resistance levels: $0.00001880, $0.00002490, $0.00002990
Support levels: $0.00001160, $0.00001000, $0.00000800
LBLOCK/USD – Daily Chart
The daily chart shows that LBLOCKUSD is undergoing a minor correction to the downside.
Examining the price action, LBLOCKUSD has been consolidating within a range for an extended period, with strong support around $0.00001160 and resistance near $0.00001880. A recent breakout attempt saw the price test the resistance level, indicating increased interest from buyers.
The current formation shows higher lows, a sign of accumulating demand. The presence of long wicks at lower levels further suggests buyers are stepping in, preventing deeper declines.
 What is the market outlook of LBLOCK/USD?
 What is the market outlook of LBLOCK/USD?
Going forward, if LBLOCKUSD breaks and holds above $0.00001880, it could trigger a bullish rally towards the next resistance at $0.00002490. Sustained momentum could even push the price to $0.00002990, where significant resistance lies.
However, failure to hold above current levels may lead to a pullback toward $0.00001440, which should act as support before another bullish attempt. The overall market structure favours an upside breakout, provided buyers maintain strength.
LBLOCK/USD – Four-Hour Chart
 LBLOCK/USD – Four-Hour Chart
The MACD indicator shows weakening bearish momentum as the histogram bars shrink, suggesting a potential reversal. The SMA (9) is acting as dynamic support, with the price attempting to reclaim this level after a brief dip.
Key support is at the 78.6% Fibonacci retracement level, while a breakout above $0.00001690 could drive the price toward $0.00001880. If buyers gain control, the next major target is beyond $0.00002000.
Lucky Block (LBLOCK) Current Statistics
The current price: $0.00001440
Market Capitalization: $1,040,000
Trading Volume: $7,810
Do you need a coin that will 100X soon? Get LBLOCK here