POL (ex-MATIC) Price Prediction: POL/USDT Assumes a Subdued Look Below Key Levels
Estimated Reading Time: 3 minutes
Don’t invest unless you’re prepared to lose all the money you invest. This is a high-risk investment and you are unlikely to be protected if something goes wrong. Take 2 minutes to learn more

POL (ex-MATIC) Price Prediction (January 25):
Price action in the POL (ex-MATIC) token remains below key technical landmarks, highlighting the dominance of downward forces. This bearish sentiment may continue to favor sellers in the market.
POL/USDT Long-Term Trend: Bearish (Daily Chart)
Key Price Levels:
Resistance: $0.5000, $0.5500, $0.6000
Support: $0.4000, $0.3500, $0.3000
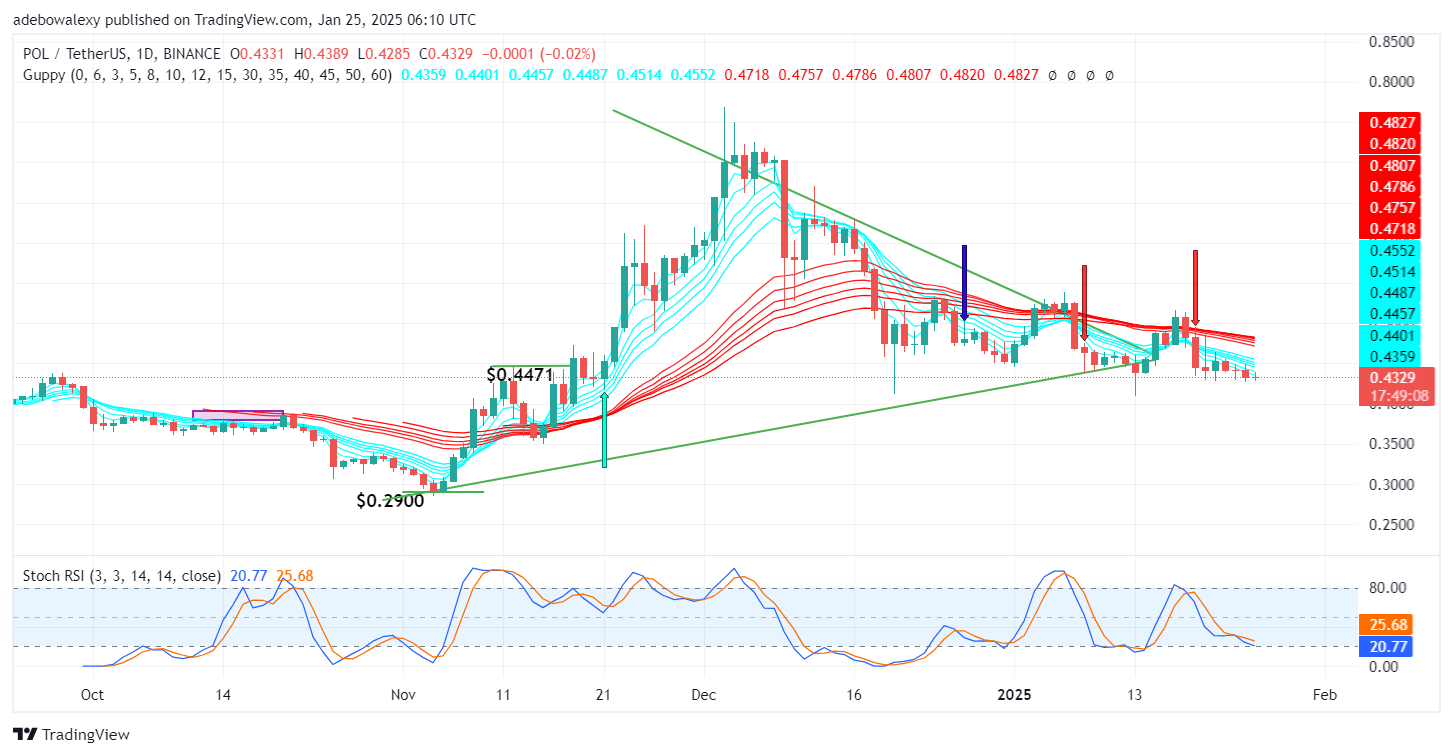
The POL (ex-MATIC) market initially experienced a bullish breakout, as indicated by a symmetrical triangle pattern. However, the current price candle for the ongoing session has formed below all the Guppy Multiple Moving Average (GMMA) lines. The size of the candle is relatively small, but its red color signals bearish dominance. Moreover, the Stochastic Relative Strength Index (RSI) lines are trending slightly downward and are now testing the 20 level of the indicator, suggesting increasing bearish momentum.
POL (ex-MATIC) Price Prediction: Bears Poised for More Wins
On the daily chart, the POL (ex-MATIC) market presents a discouraging outlook for bullish traders. The earlier bullish breakout has been overpowered by strong selling pressure, forcing the price below the GMMA lines.
The Stochastic RSI lines continue to edge downward, nearing the oversold region, reinforcing the presence of bearish sentiment. The red price candle positioned below the GMMA lines further supports the expectation of additional price declines. This setup indicates that the bears remain firmly in control.
POL (ex-MATIC) Price Prediction: Bears Strengthen Their Hold (4-Hour Chart)
The 4-hour chart for POL (ex-MATIC) reinforces the bearish sentiment. The latest price candle is red and situated below all the GMMA lines, mirroring the daily chart’s behavior. This alignment between timeframes strengthens the bearish outlook. Additionally, the Stochastic RSI lines are descending sharply toward the 50 level, signaling to intensify bearish momentum.
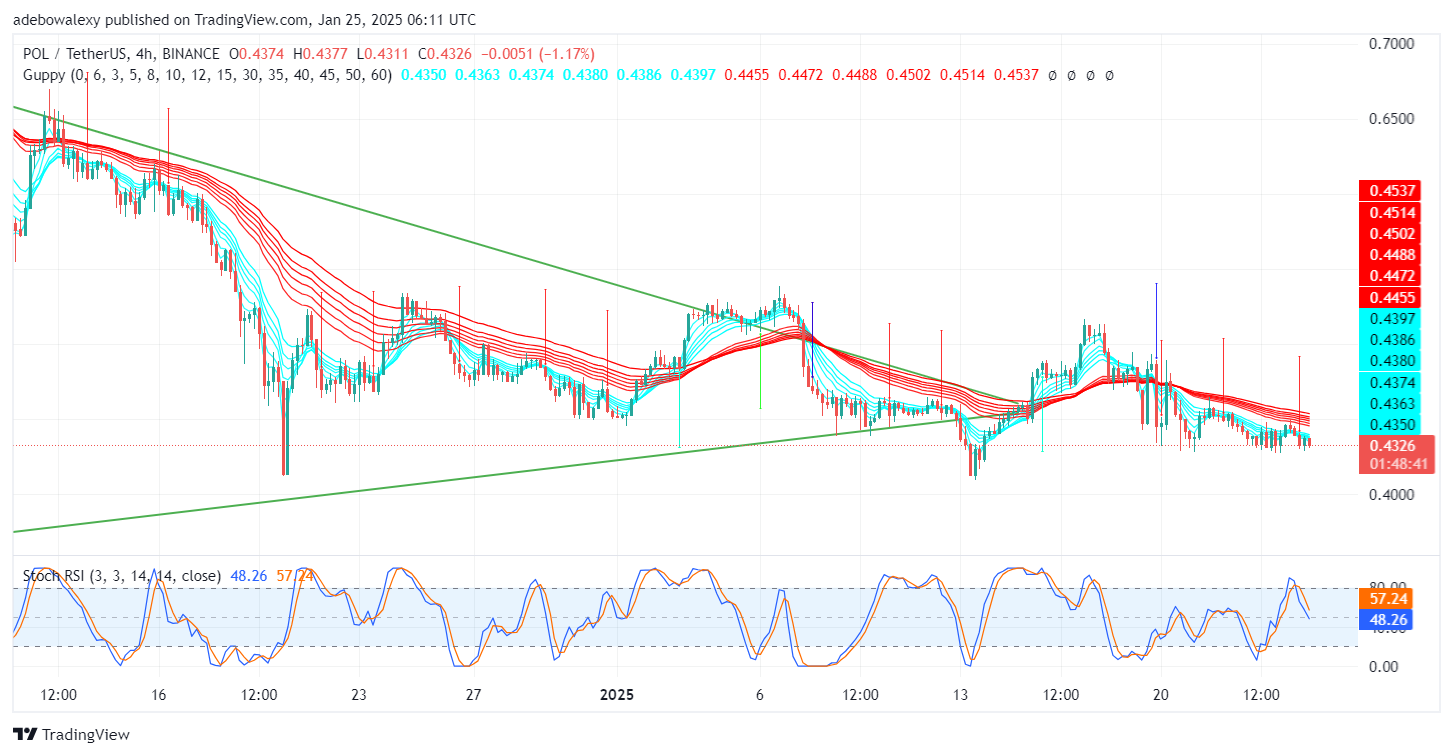
This suggests that the price may soon test a more critical support level around $0.4000. In summary, current technical indicators on both the daily and 4-hour charts point to a continuation of bearish activity, with a possible retest of lower support levels in the near term.