Solana (SOL) Price Prediction: SOL/USDT Maintains Position Above $240
Estimated Reading Time: 3 minutes
Don’t invest unless you’re prepared to lose all the money you invest. This is a high-risk investment and you are unlikely to be protected if something goes wrong. Take 2 minutes to learn more

Solana (SOL) Price Prediction (January 24):
The Solana market has established a solid base at the $240 price level. Since surpassing this threshold, trading activity has generally remained above this key level. Recent market behavior also reflects activity above crucial technical levels, which could support further price growth as the session progresses.
SOL/USDT Long-Term Trend: Bearish (Daily Chart)
Key Price Levels:
Resistance: $250.00, $270.00, $290.00
Support: $240.00, $220.00, $200.00
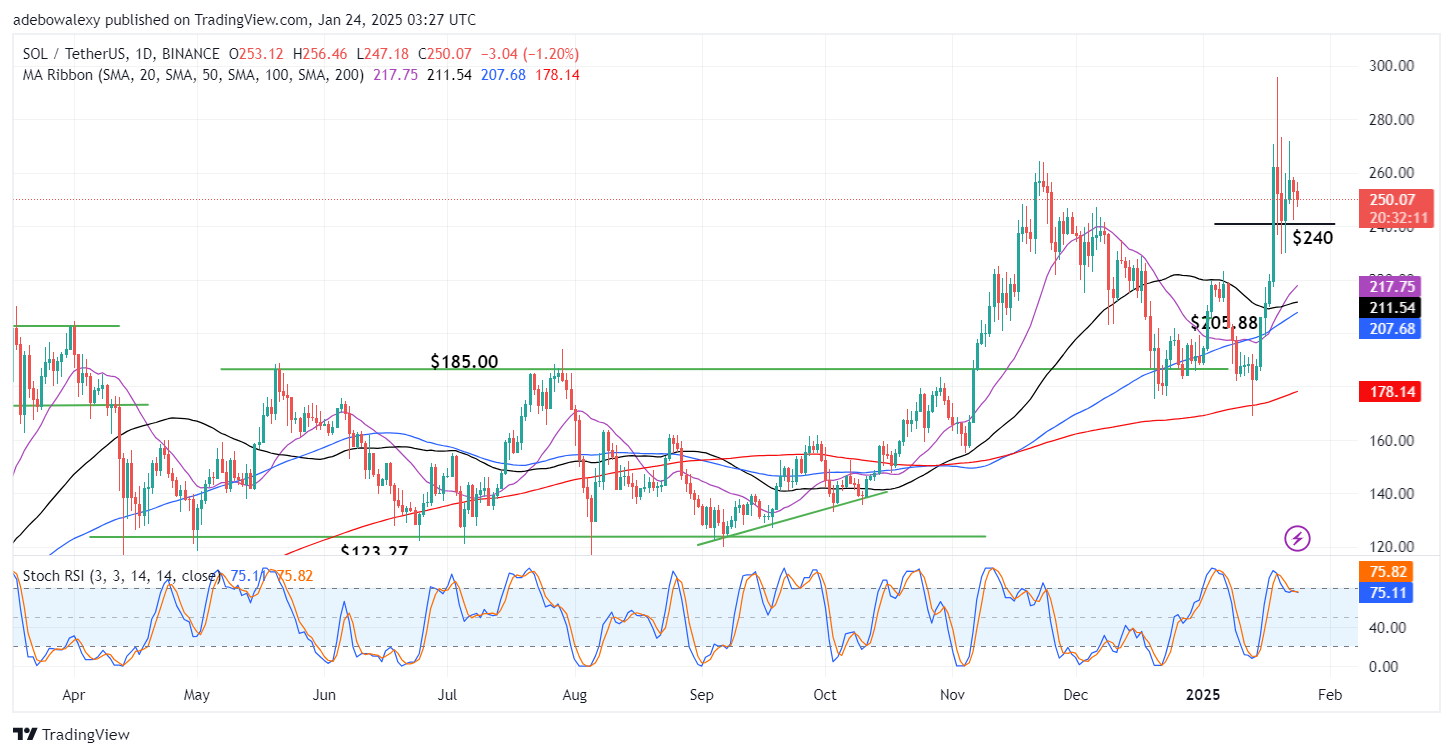
On the daily chart, the latest price candle is positioned significantly above all the Moving Average (MA) lines, even though the candle appears red. The Stochastic Relative Strength Index (RSI) lines show a downward movement toward the 80 mark, with a slight sideways trajectory just below this level.
Solana (SOL) Price Prediction: Bearish Momentum Slows Above $240 Threshold
Observing Solana’s price activity above the $240 level reveals increased volatility, particularly in the last five sessions, where prices approached the $300 mark, nearly setting a new all-time high. However, bearish pressures prevented this milestone, causing a pullback. Despite this, subsequent sessions have maintained a position above the $240 level.
Trading activity continues above all MA lines, signaling that the upward correction remains intact. However, the retracement towards $240 shows reduced momentum. Additionally, the Stochastic RSI lines have merged, suggesting that bearish forces are encountering resistance, preventing significant downward movement.
Solana (SOL) Price Prediction: SOL/USDT Holds Above a Key Level (4-Hour Chart)
On the Solana 4-hour chart, price action remains above all MA lines. The latest price candle is positioned just above the 20-day MA line, which itself lies above the other MA lines. Meanwhile, the Stochastic RSI lines are in the oversold region but are showing an upward trajectory.
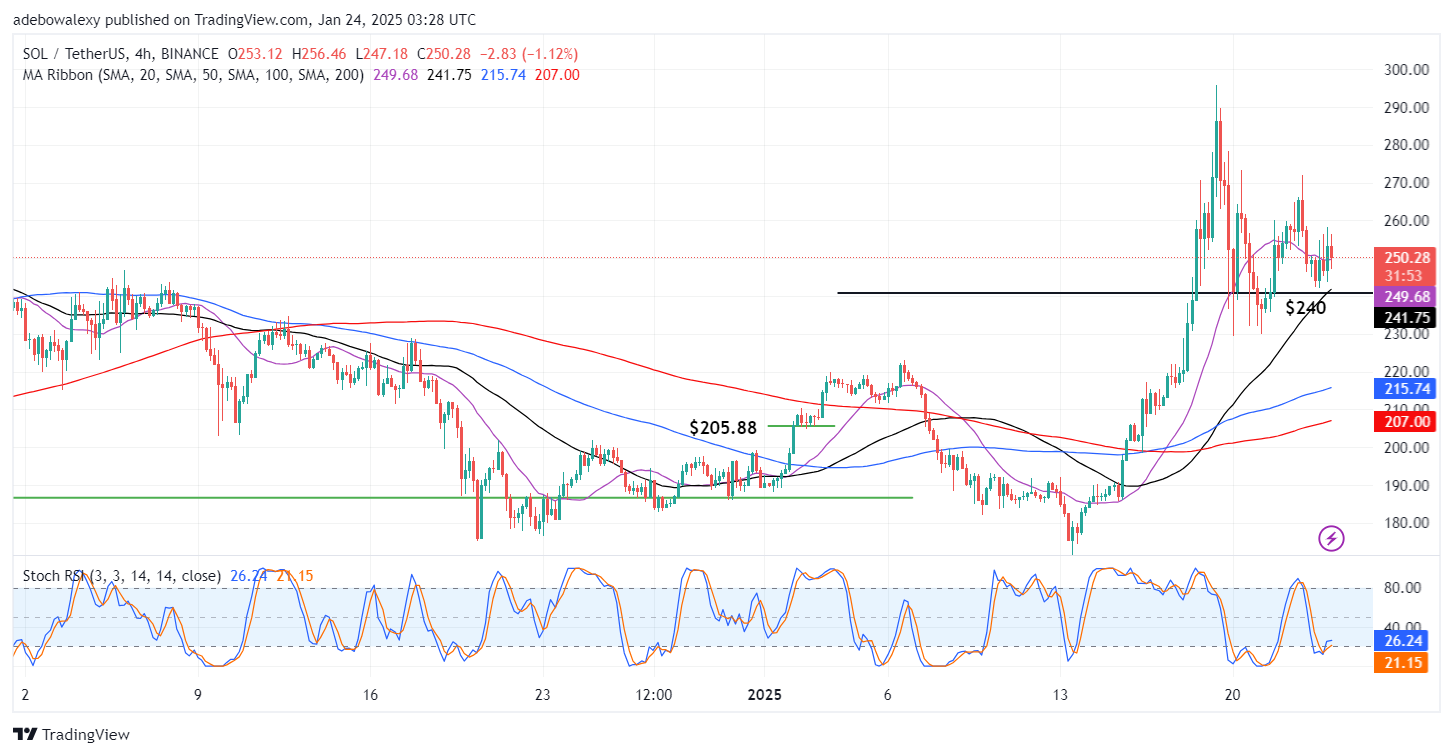
Technically, the position of price action above all MA lines and the upward trajectory of the Stochastic RSI in the oversold region strongly indicate the market is still in an uptrend. These factors suggest the potential for upward momentum to propel the market toward the $260 and $270 resistance levels.