Uniswap (UNI) Price Prediction: UNI/USDT Moves Further South
Estimated Reading Time: 2 minutes
Don’t invest unless you’re prepared to lose all the money you invest. This is a high-risk investment and you are unlikely to be protected if something goes wrong. Take 2 minutes to learn more
Uniswap (UNI) Price Prediction (January 23):
The Uniswap market has just breached a medium-term support level at $12.74. Technically, this indicates strong bearish momentum. Current technical indicators suggest that sellers are firmly in control, strengthening the downtrend and driving the market further south.
UNI/USDT Long-Term Trend: Bearish (Daily Chart)
Key Price Levels:
Resistance: $15.00, $17.50, $20.00
Support: $12.00, $10.00, $8.00
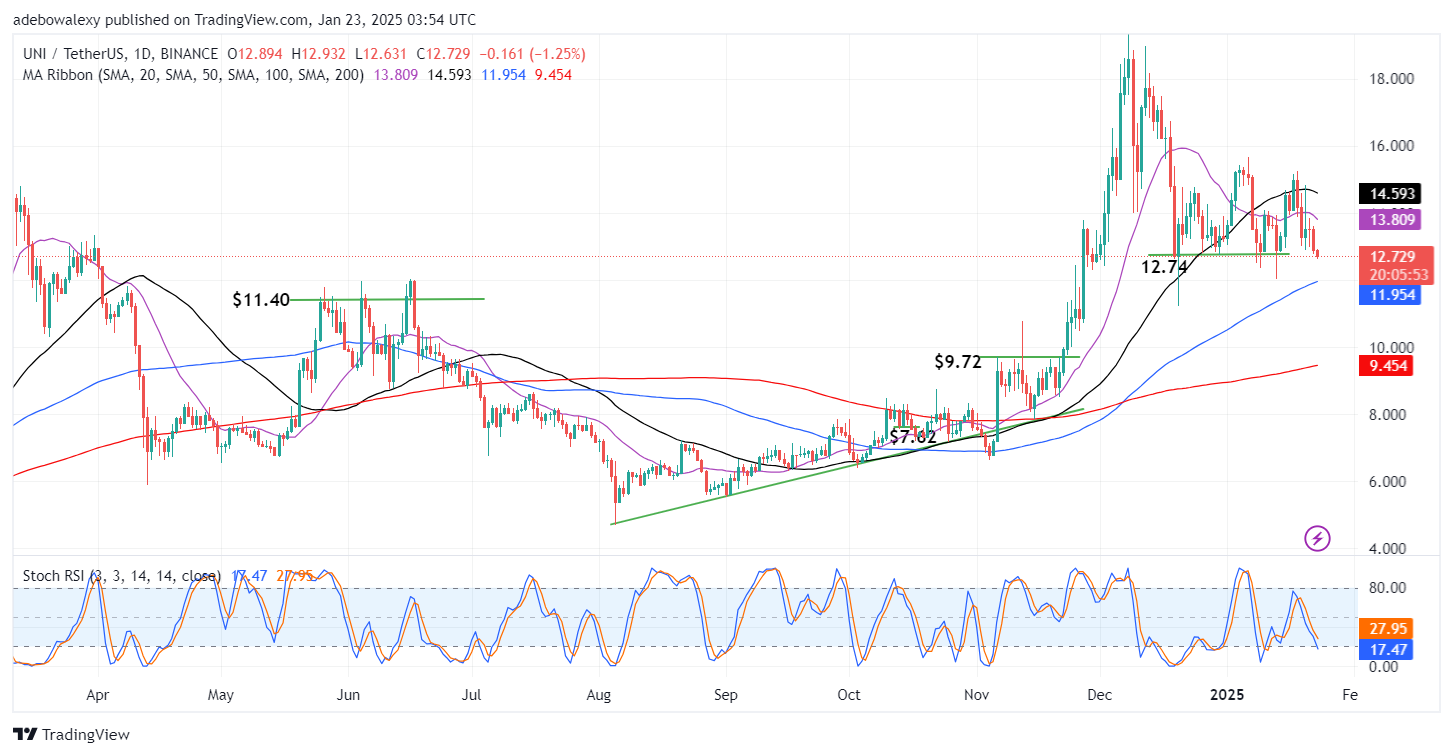
The most recent price candle on the daily chart reveals continued selling pressure. As a result, the price has fallen below the $12.74 threshold. Price activity remains beneath all the Moving Average (MA) lines, underscoring bearish dominance. Additionally, the Stochastic Relative Strength Index (RSI) lines have dropped below the 20 level, signaling oversold conditions. The downward trajectory of the RSI lines suggests that bearish momentum may persist.
Uniswap (UNI) Price Prediction: UNI/USDT Eyes the $12.00 Price Level
On the daily chart, Uniswap shows a bearish setup. Over the past five sessions, sellers have gained dominance, pushing the price below the 20- and 50-day MA lines. As of today, selling pressure has intensified, resulting in the breach of medium-term support at $12.74.
The market now lies between the four MA lines visible on the chart. Meanwhile, the RSI lines continue descending deeper into the oversold region, with the lead line breaking below the 20 level. This setup suggests further price declines are likely.
Uniswap (UNI) Price Prediction: UNI/USDT Remains Under Selling Pressure (4-Hour Chart)
On the 4-hour chart, price action continues to trend lower. Recent price candles are of similar size, reflecting steady selling pressure. The ongoing session’s price candle remains red, with price activity staying below all MA lines on the chart.
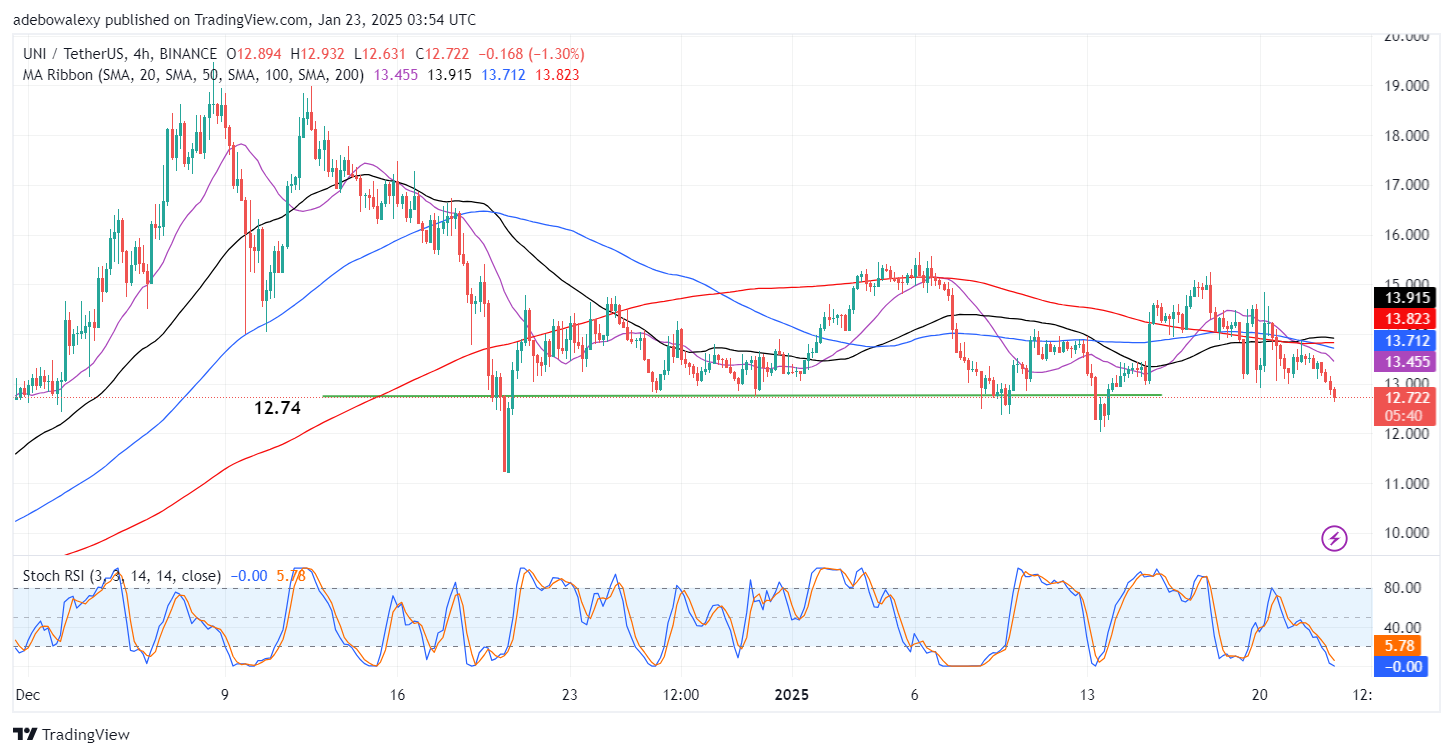
The Stochastic RSI lines are now at the lower end of the oversold region. This aligns with the bearish outlook from the daily chart. Given that price action on the shorter time frame remains below all MA lines and the RSI remains oversold, the market is likely to target the $12.00 support level soon.