Bitcoin (BTC) Price Prediction: BTC/USDT Stabilizes Above the $100,000 Threshold
Estimated Reading Time: 3 minutes
Don’t invest unless you’re prepared to lose all the money you invest. This is a high-risk investment and you are unlikely to be protected if something goes wrong. Take 2 minutes to learn more

Bitcoin (BTC) Price Prediction (January 22):
The Bitcoin market has recently surged above the $100,000 milestone, experiencing significant price movements over the past two sessions. Notably, the market hit a new all-time high of $109,956 and closed above $107,000 in the previous session.
BTC/USDT Long-Term Trend: Bullish (Daily Chart)
Key Price Levels:
Resistance: $110,000, $115,000, $120,000
Support: $105,000, $100,000, $90,000
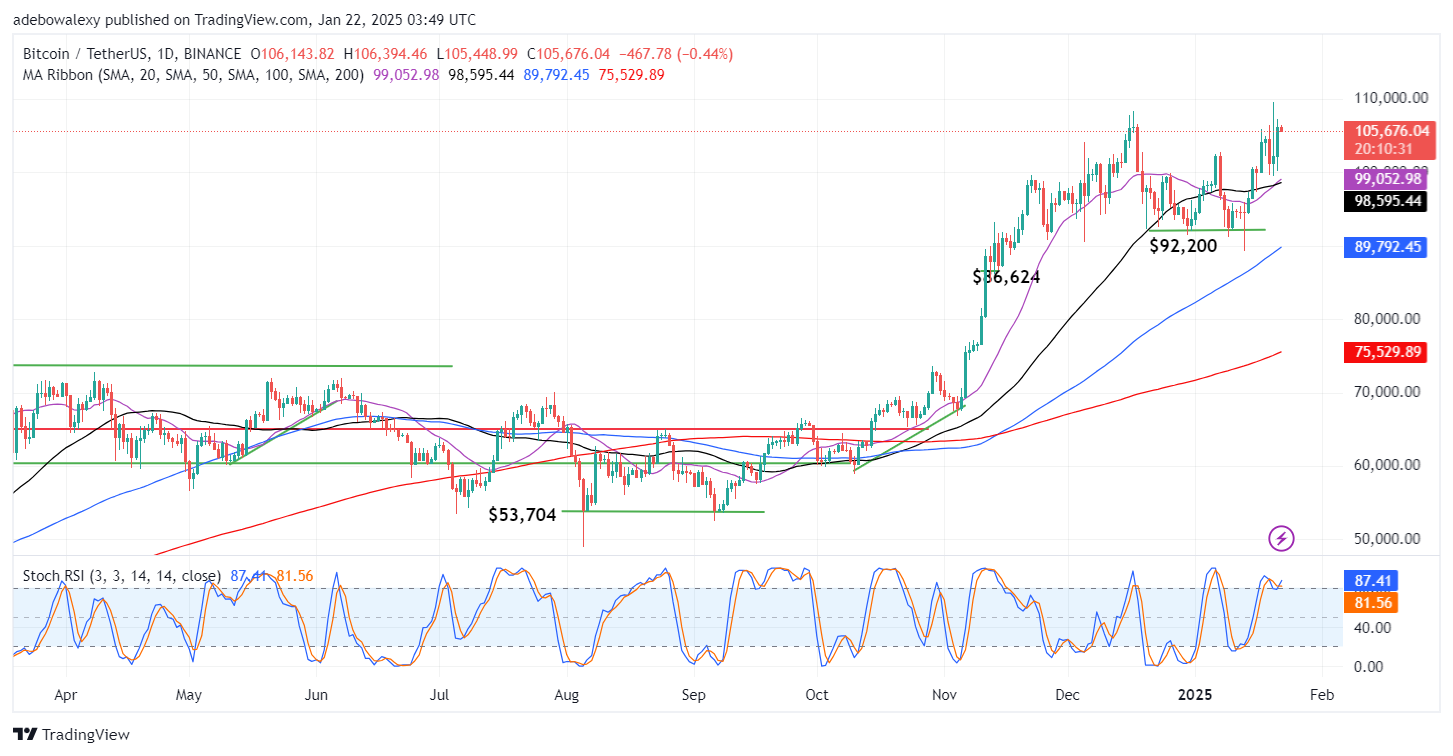
The current session has seen a minor downward retracement, as evidenced by the red price candle. However, Bitcoin remains well supported above the $105,000 level and continues to trade above all Moving Average (MA) lines. The Stochastic Relative Strength Index (RSI) also signals bullish momentum, with its lines projected upward after a recent crossover above the 80 level. Despite the minor pullback, the market shows strong upward potential.
Bitcoin (BTC) Price Prediction: BTC/USDT Market Primed for Further Upside
Although Bitcoin’s daily chart shows slight downward corrections, the overall trend remains bullish. The last price candle is clearly above all MA lines, and a recent crossover between the 20-day and 50-day MAs suggests continued upward momentum.
Similarly, the Stochastic RSI’s bullish crossover is still in its early stages, further supporting the case for sustained upward movement. Technically, bullish forces remain dominant, and traders might consider holding their positions as further gains appear likely in the near term.
Bitcoin (BTC) Price Prediction: BTC/USDT May Rebound Near $105,000 (4-Hour Chart)
On the 4-hour chart, Bitcoin has seen downward retracements for two consecutive sessions, as reflected by the last two red candles. Despite this, the cryptocurrency remains above all MA lines and holds firm above the psychological support level of $105,000.
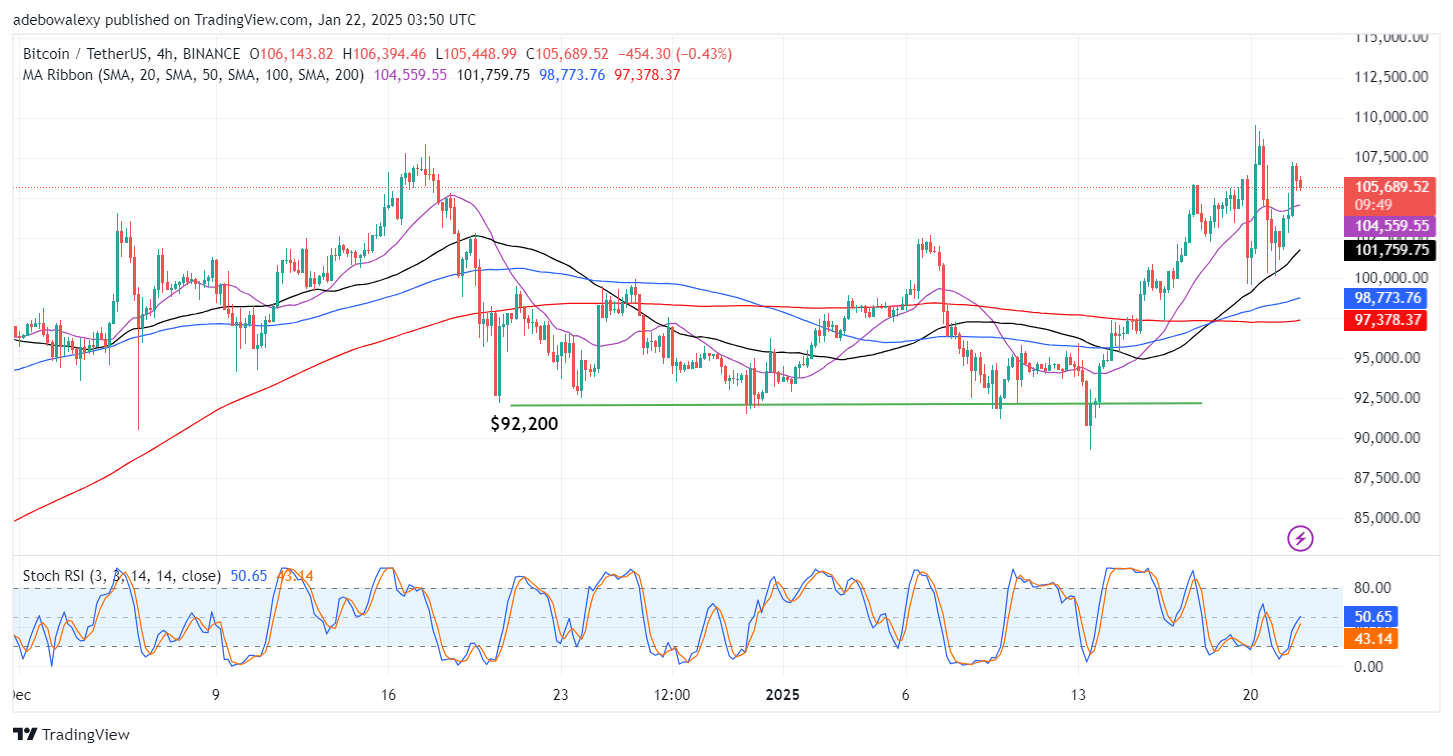
The Stochastic RSI shows upward movement as it emerges from the oversold region, with the lead line nearing the 50 level. While the line shows slight deflection, the overall trend remains promising. Given the psychological support at $105,000, traders can anticipate a potential rebound toward the $110,000 resistance and possibly higher levels.