Litecoin (LTC) Price Prediction: LTC/USDT Faces Strong Headwinds at $140 Resistance
Estimated Reading Time: 2 minutes
Don’t invest unless you’re prepared to lose all the money you invest. This is a high-risk investment and you are unlikely to be protected if something goes wrong. Take 2 minutes to learn more

Litecoin (LTC) Price Prediction (January 21):
The Litecoin market retraced to higher levels in previous sessions. However, as soon as the market reached the $140 resistance level, bulls struggled to push further. Consequently, this led to a steep decline. The market has been dipping consistently for the past three sessions.
LTC/USDT Long-Term Trend: Bearish (Daily Chart)
Key Price Levels:
Resistance: $120.00, $130.00, $140.00
Support: $110.00, $100.00, $90.00
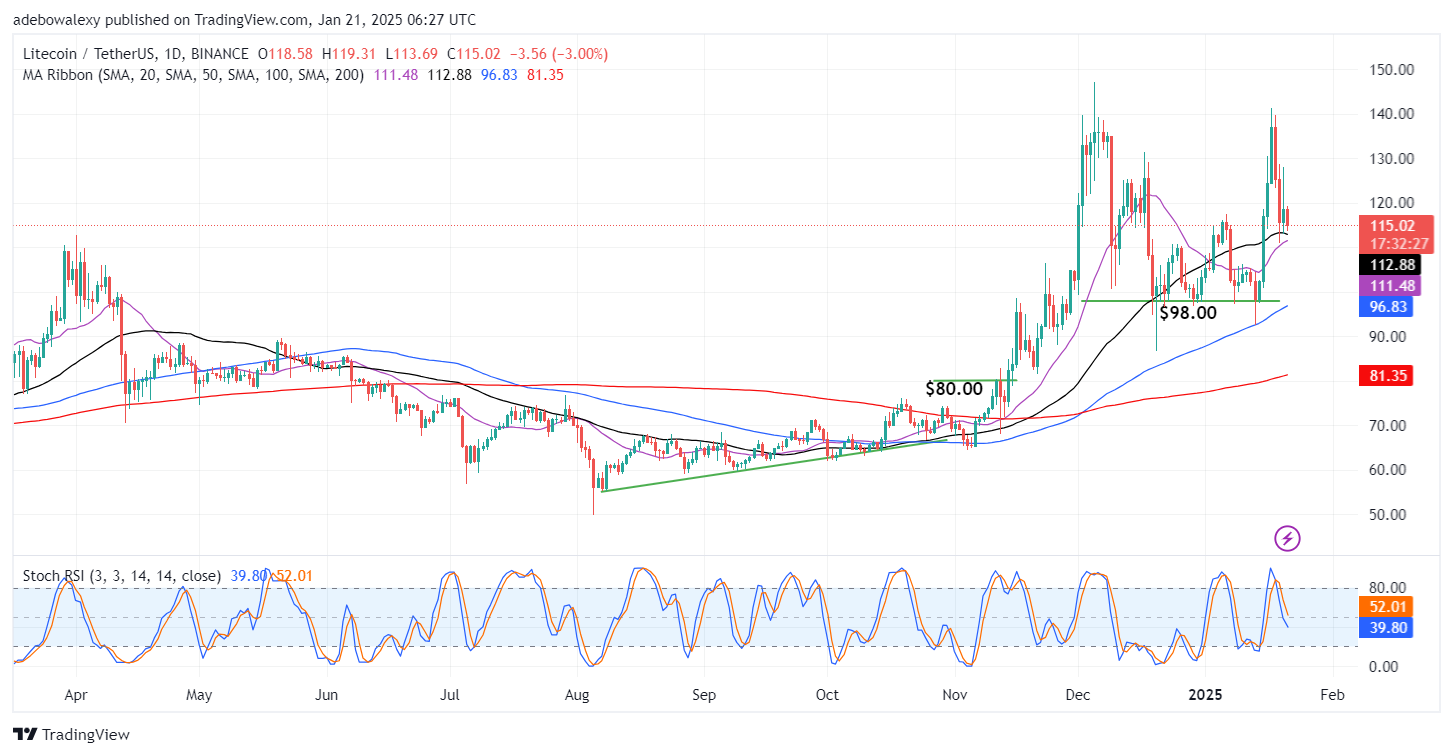
The ongoing session for Litecoin is bearish, showing moderate downward retracement. Despite this, price action remains above all the Moving Average (MA) ribbons as the token trades at $115.02. The Stochastic Relative Strength Index (RSI) lines are also diving, with only a slight deflection in the lead lines, suggesting that bearish forces may still dominate.
Litecoin (LTC) Price Prediction: Bears Dominate the LTC/USDT Market
Price action in Litecoin’s daily market has continued its downward trend. As mentioned, the decline began when the market reached the $140 resistance level. The downward retracement was sharp, causing the price to fall through multiple psychological supports. The token now trades at $115.02 but remains above all MA lines on the chart.
Furthermore, the ongoing session suggests that headwinds remain strong, as indicated by the corresponding price candle. Meanwhile, the Stochastic RSI lines maintain a downward trajectory, suggesting the potential for further bearish movement. This implies that the price action may soon fall below some of the MA lines.
Litecoin (LTC) Price Prediction: LTC/USDT Eyes $110 Support (4-Hour Chart)
The Litecoin 4-hour chart provides a clearer picture. Here, price action has been bearish for the past two sessions. The most recent price candle has pushed the token’s price below the 50-day MA line.
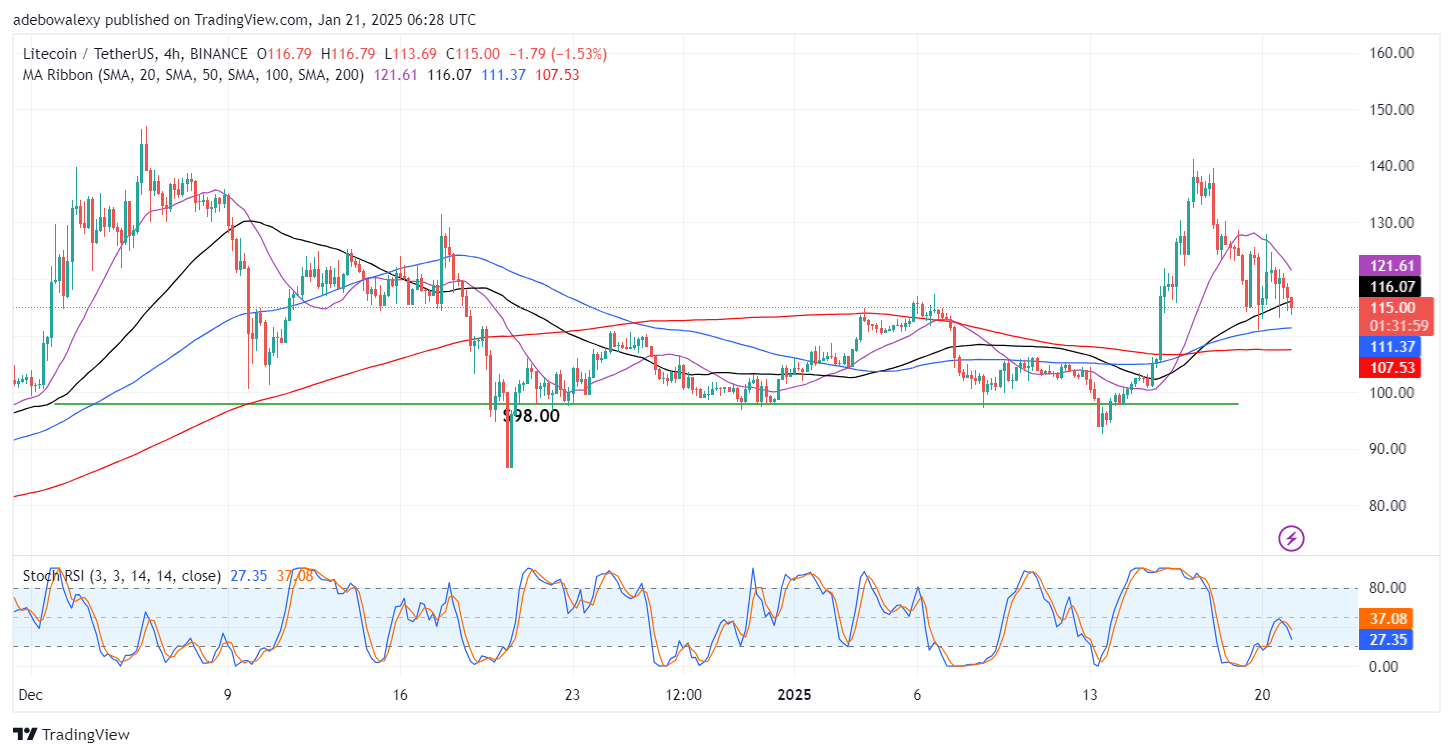
The Stochastic RSI lines are also falling into the oversold region, reflecting the bearish retracement. With the price now below the 50-day MA curve, the most recent price candle suggests the market is likely heading toward the $110 support level.