Bitcoin (BTC/USD) Price Lessens Close to $30,000
Estimated Reading Time: 3 minutes
Don’t invest unless you’re prepared to lose all the money you invest. This is a high-risk investment and you are unlikely to be protected if something goes wrong. Take 2 minutes to learn more
Bitcoin Price Prediction – July 19
The BTC/USD price lessens now close to the valuation of $30,000 to trade around the point of $31,649. The crypto’s market rate stands at about the level of -1.16.
BTC/USD Market
Key Levels:
Resistance levels: $35,000, $40,000, $45,000,
Support levels: $30,000, $27,500, $25,000
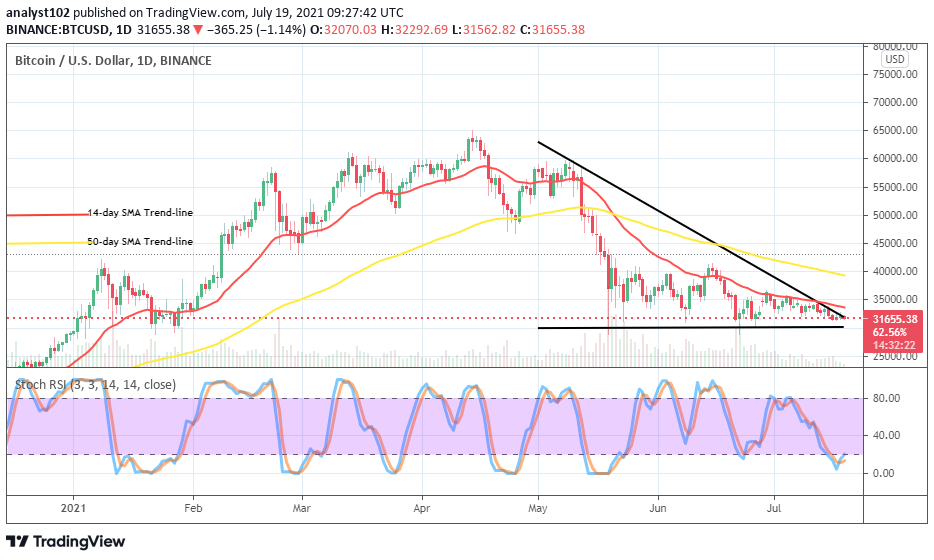
BTC/USD – Daily Chart
The BTC/USD daily chart currently depicts that price lessens in a valuation close to $30,000 where the critical support baseline is. The 14-day SMA indicator is beneath the 50-day SMA indicator, with a notable space between them. The bearish trend-line drew downward across the SMAs, indicating the degree to which the crypto economy has pushed southward closely to the point earlier mentioned. The Stochastic Oscillators have touched a notable depth trading point in the oversold region, suggesting a probable end of the pressures inflicted on the crypto economy.
Could there still be a push southwardly against the point at $30,000 as price lessens closely to it?
It now seems that the market operation of BTC/USD may not push fearfully southward beyond the point of $30,000 in the near session as even though the price lessens close to it. The crypto market remains trading around the ranges of $35,000 and $30,000. Currently, the pressure to the downside is getting reduced so that bulls may find a re-launch of their positions. However, the signal to sufficiently back the entry isn’t presently featuring.
On the downside analysis, as at the time of writing, bears have almost exhausted their strength. As price lessens near the critical support baseline, it has been tough against the keeping of position underneath it in the previous sessions. As a result that, bears needed to suspend shorting around the line mentioned earlier.
BTC/USD 4-hour Chart
On the BTC/USD medium-term chart, the crypto market operations move in ranges of $35,000 and $32,500. Presently, the price lessens slightly past the lower range line. Like wisely, the 14-day SMA indicator has also moved briefly past the lower range line as the 50-day SMA indicator is above it. The Stochastic Oscillators are pointing southbound to indicate that a downward force is ongoing. If heightened, the crypto economy may push for finding support between the levels of $30,000 and $27,500 in the long run.
Note: Cryptosignals.org is not a financial advisor. Do your research before investing your funds in any financial asset or presented product or event. We are not responsible for your investing results.
You can purchase crypto coins here. Buy Tokens

