ChainLink (LINK/USDT) Eyes $16.93 Dynamic Level as Bulls Gain Strength
Estimated Reading Time: 3 minutes
Don’t invest unless you’re prepared to lose all the money you invest. This is a high-risk investment and you are unlikely to be protected if something goes wrong. Take 2 minutes to learn more

ChainLink Technical Analysis: Ranging
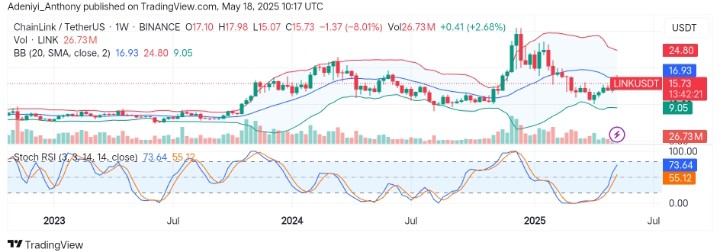
The market for Chainlink against the Tether has recently cooled off after what seemingly looks like an aggressive Q1 2025 rally, correcting above a $24 high to a current price of $15.73. However, the pair is attempting a recovery bounce, but selling pressure remains visible below key resistance zones.
Recently, the pair has printed a bullish bounce from the lower Bollinger Band around the $9.00 level, aiming at the 20-week SMA midpoint and pushing forward to claim the $16.93 dynamic line. However, despite the bearishness this week, the Stochastic oscillator’s lines still point to the north, indicating bullish strength is not fully exhausted.
Currently, Chainlink trades at $15.73, printing 8.01% loss with 26.73 million traded volumes for the week.
Technical Indicators
Major Resistance Levels: $16.93, $19.50, and $24.80
Major Support Levels: $13.00, $9.05, and $6.70
Chainlink Technical Analysis
The analysis of Chainlink against the Tether on the weekly timeframe shows the pair is at an important level, with the bulls targeting the $16.90 level. However, the Bollinger Bands indicate the price operates between the lower segment of the band, showing contraction. Therefore, a breakout above $16.93 could open a new buying opportunity.
On the other hand, the Stochastic RSI signals an impending bullishness with improving volume as the bullish momentum build. As it stands, the indicator pictures a near-overbought situation, allowing further upside.
To this end, a rejection at the current level may signal weakness and a deeper retracement. However, momentum is building, but confirmation is essential before entering a trade.
LINK/USDT Analysis: Where from Here?
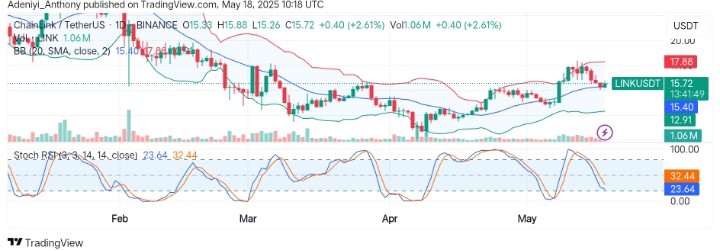
On the daily timeframe, LINK/USDT shows a pullback after recent rally. However, the price is hovering above the dynamic line, pointing to a short-term bullish structure despite the recent pullback.
From one angle, the Bollinger Bands are converging, suggesting a potential breakout ahead. On the other, the Stochastic RSI is curling upward from oversold levels (currently at 23.64 & 32.44), indicating a possible bullish reversal setup. However, the selling volume has declined during the recent dip, implying weakness in selling pressure, but with the closest support at $15.40, resistance is clearly marked at $17.88.
To this end, a break above $16.90 in the near term could propel the pair towards $24.80; otherwise, selling pressure may pull the price south.
You can purchase crypto coins here. Buy LBlock