Enjin Coin Breaks as Bearish Trend Intensifies
Estimated Reading Time: 3 minutes
Don’t invest unless you’re prepared to lose all the money you invest. This is a high-risk investment and you are unlikely to be protected if something goes wrong. Take 2 minutes to learn more

ENJ/USD Price Analysis – Sellers Holds Solid Grip
Enjin Coin market is experiencing an intensified corrective phase as sellers have successfully breached a key support level, signaling a continuation of the downtrend. A strong rejection from major resistance last week has given bears firm control of the price action. The market appears to explore lower price territories.
Enjin Coin Key Levels
Support Levels: $0.0560
Resistance Levels: $0.0760, $0.0940

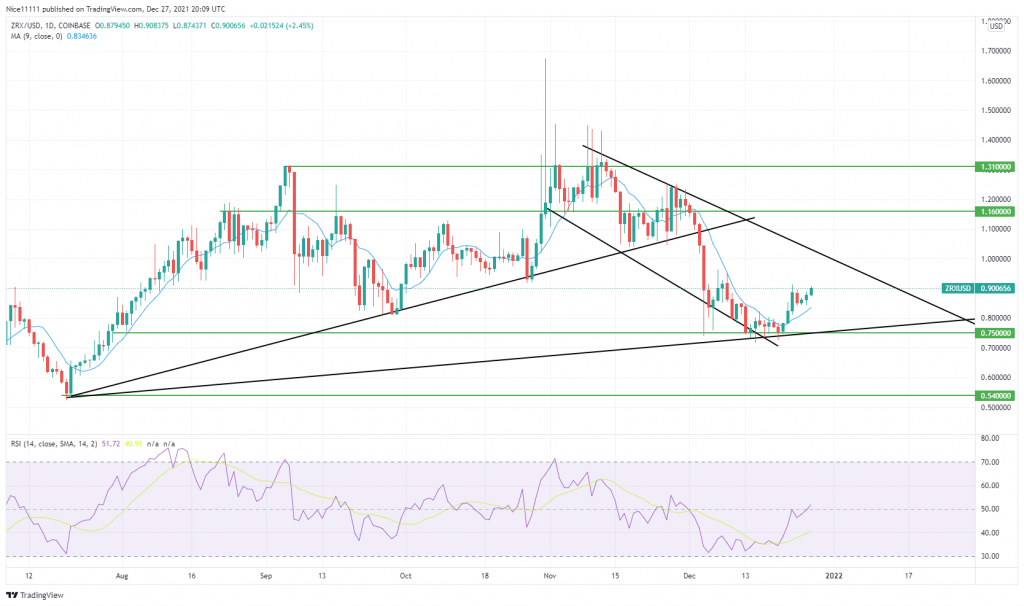
The daily chart for ENJ/USD shows a market that, while broadly range-bound, is currently dominated by strong bearish momentum. A significant rally in July was decisively halted at the $0.0949 resistance zone, which triggered the current corrective trend. Sellers have since been in control, pushing the price progressively lower.
Currently trading at $0.0700 key zone, the price has just broken below the key horizontal support level at $0.0722. This is a significant bearish development that suggests the correction is not yet over. The former support is now likely to act as new resistance. With bears in control, the next major target to the downside is the long-term range low at $0.0564.
The technical indicators on this chart are firmly bearish. The Relative Strength Index (RSI), at 42.66, is well below the neutral 50 level and pointing down, confirming that selling pressure is dominant. The Percentage Price Oscillator (PPO) also displays a strong bearish signal, with the PPO line having crossed below its signal line and the histogram showing strong, sustained negative momentum.

Market Expectation
The 4-hour chart provides a clear and detailed view of the established downtrend. The price has been forming a consistent series of lower highs and lower lows since its peak around July 21st. Trading at $0.0701 for a loss of -1.04%, the price is actively pushing to new local lows, underscoring the strength of the sellers.
The short-term trend is unequivocally bearish. The recent breakdown below the $0.0722 support level has opened up a clear path for sellers to continue driving the price lower. Any potential bounces are likely to be short-lived and met with selling pressure unless the bulls can reclaim the broken support level.
The Relative Strength Index (RSI) is deep in bearish territory at 35.48 and is approaching oversold conditions, reflecting the intensity of the recent selling. The Percentage Price Oscillator (PPO) is positioned well below the zero line, with the PPO line below its signal line. This configuration is indicative of an established and healthy downtrend with significant negative momentum.
You can purchase Lucky Block here. Buy LBLOCK
Note: Cryptosignals.org is not a financial advisor. Do your research before investing your funds in any financial asset or presented product or event. We are not responsible for your investing results