Uniswap (UNI) Price Prediction: UNI/USDT Maintains a General Upward Trajectory
Estimated Reading Time: 3 minutes
Don’t invest unless you’re prepared to lose all the money you invest. This is a high-risk investment and you are unlikely to be protected if something goes wrong. Take 2 minutes to learn more

The Uniswap market has been seeing significant volatility in recent times. This has resulted in the market oscillating within a price range of $9.72 and $7.90. In more recent sessions, bears have maintained a strong grip on the market, yet the coin continues to trade above key levels.
UNI/USDT Long-Term Trend: Bullish (Daily Chart)
Key Price Levels:
Resistance: $9.00, $9.50, $10.50
Support: $8.50, $7.50, $6.50
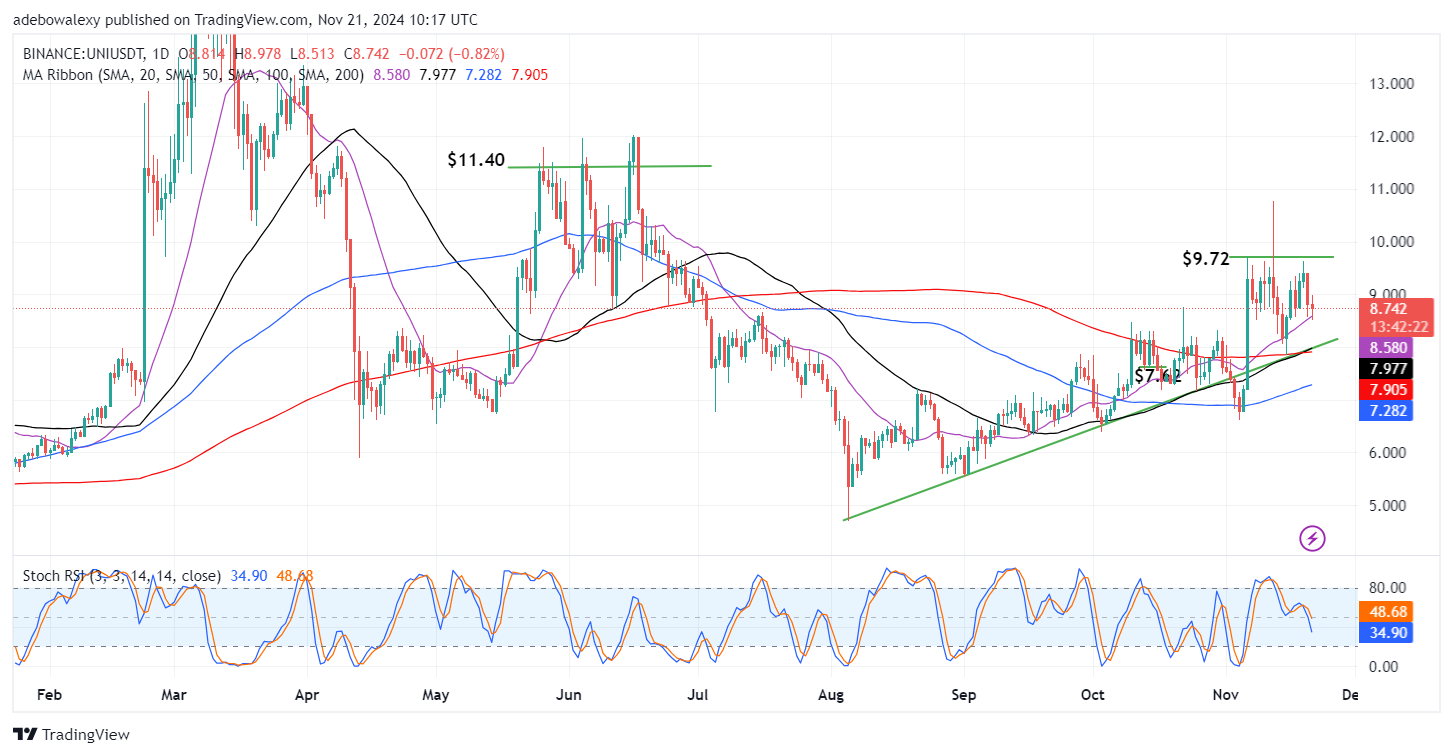
The last price candle corresponding to the ongoing session can be seen appearing red and with a small body above the Moving Average (MA) Ribbon. This happened after the market tested the 20-day MA line in the previous session after the market saw a strong dip. Despite this, the Stochastic Relative Strength (RSI) lines can be seen still descending into the oversold region. The leading line can be seen to have fallen considerably below the 50 mark, while the lagging line can be seen roughly at the 50 mark of the indicator.
Uniswap (UNI) Price Prediction: UNI/USDT Still Floats Above Favorable Technical Landmarks
Although downward forces are still in the lead in the Uniswap market, it could be seen that trading activities stay above important technical marks. The last price candle can be seen, suggesting that market forces are in a standoff. This opinion stems from the position of the mentioned price candle, as it could be seen centrally positioned.
Meanwhile, the token still trades above all the MA lines and, as such, has the tendency to go higher. The Stochastic RSI lines are still falling into the oversold region and thus hint that upside forces aren’t that strong at the moment. Therefore, this makes technical indications divergent and, as such, calls for traders to maintain caution.
Uniswap (UNI) Price Prediction: UNI/USDT Maintains a Bearish Outlook (4-Hour Chart)
Coming to the Uniswap 4-hour market, it could be seen that price action is taking on a more bearish outlook. The last price candle on this chart can be seen to have placed the current price of the token below three out of the four MA ribbons (20-, 50-, and 100-day MA lines). Meanwhile, the Stochastic RSI lines can be seen still poised upwards.
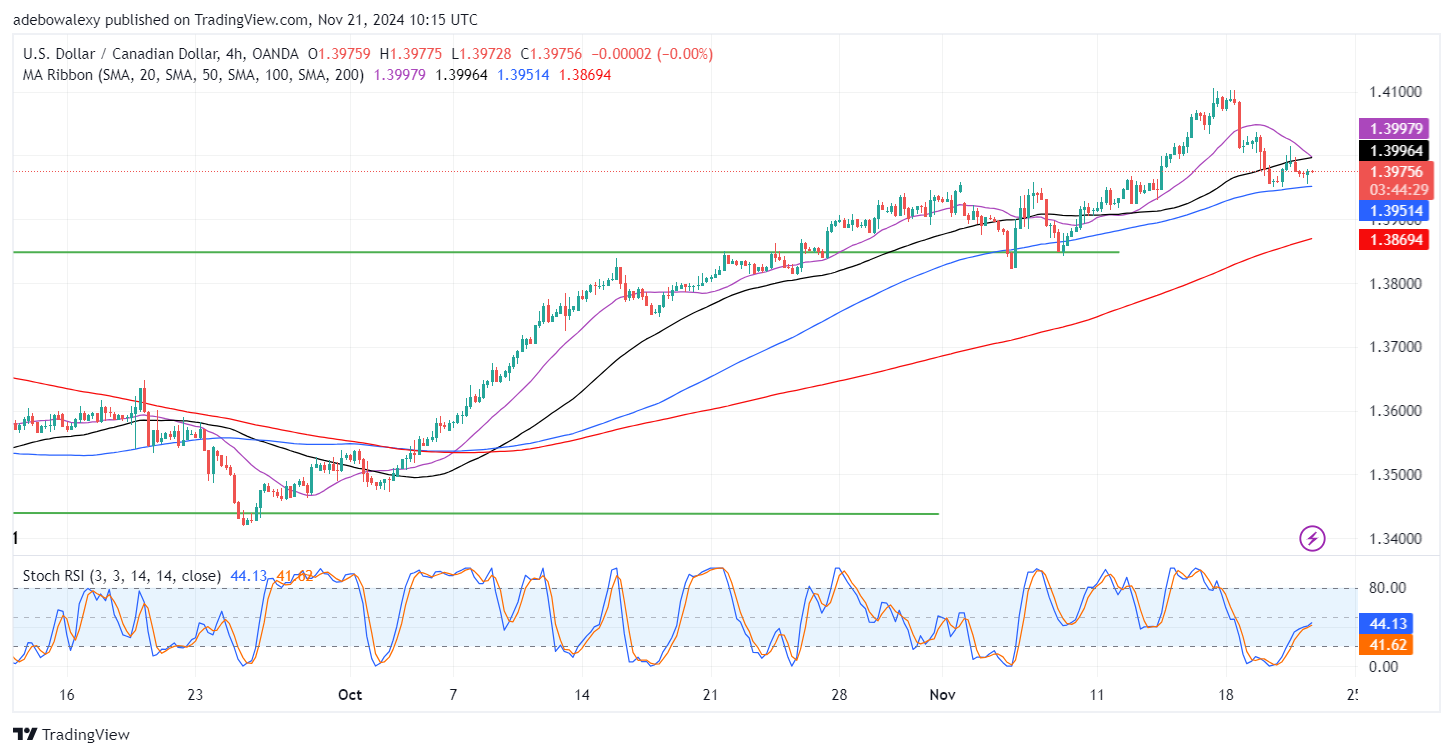
Although the general trend can still be regarded as staying on, the market’s short-term outlook hints that the market is under pressure from downward forces. The current price of this coin lies below the majority of the MA lines on the chart. Consequently, this suggests that price action has a bearish outlook. Meanwhile, the trajectory of the Stochastic RSI hints that the market’s general trend may still be preserved. However, traders can hope only to reap short-term gains from this market towards the $8.50 and $8.00 mark.