Litecoin (LTC) Price Prediction: LTC/USDT Slumps Below the $90.00 Mark
Estimated Reading Time: 3 minutes
Don’t invest unless you’re prepared to lose all the money you invest. This is a high-risk investment and you are unlikely to be protected if something goes wrong. Take 2 minutes to learn more

LTC Price Prediction for November 19
The Litecoin market has experienced significant price volatility recently. The coin’s price action has surged through multiple price levels quickly. However, the market has retreated below the $90.00 mark after breaching the $95.00 level.
LTC/USDT Long-Term Trend: Bullish (Daily Chart)
Key Price Levels:
Resistance: $90.00, $95.00, $100.00
Support: $80.00, $75.00, $70.00
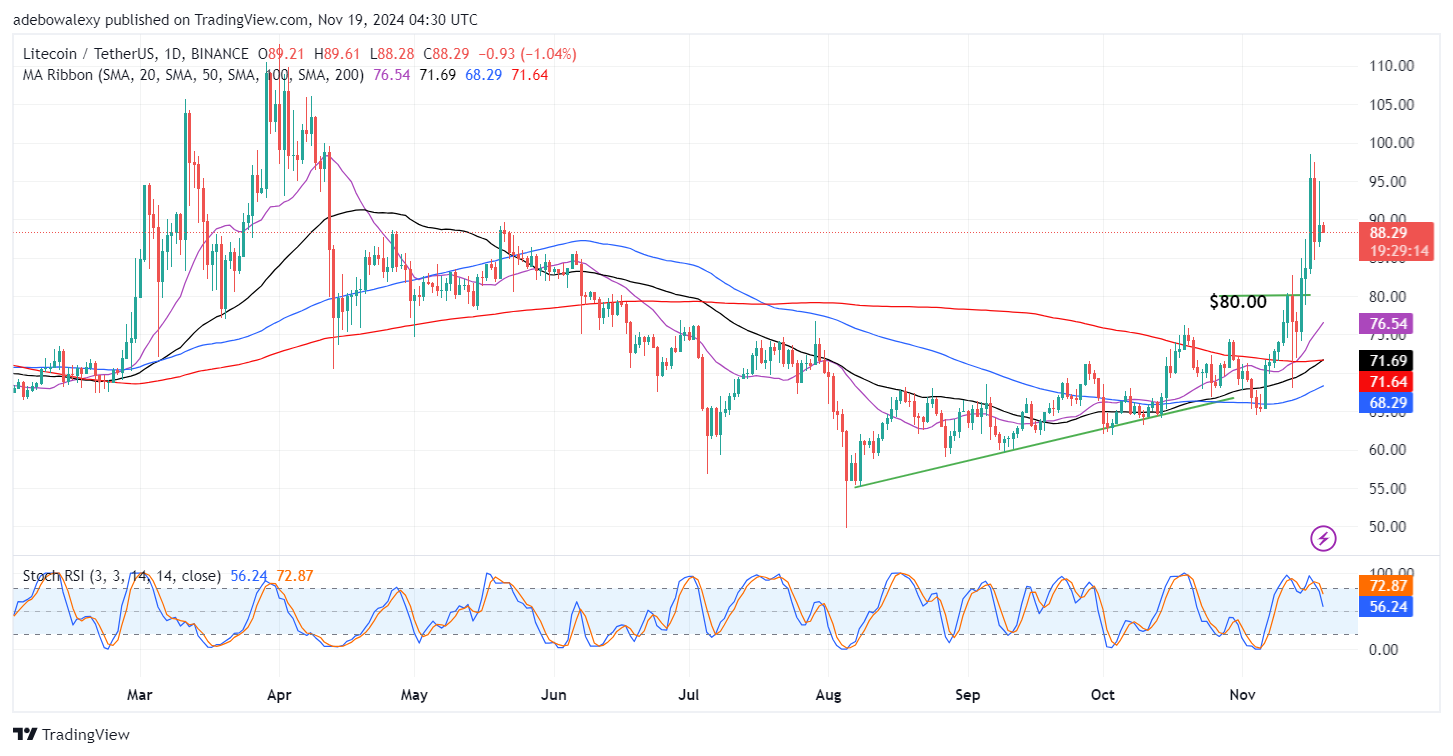
The past three price candles indicate that the market has been gradually retreating from its recent high near the $100 mark. The latest price candle is below the $90.00 threshold and is bearish. However, the price still trades above the Moving Average (MA) lines. Meanwhile, the Stochastic Relative Strength Index (RSI) lines fall below the indicator’s 80 mark. However, a convergence can be noticed on the 50-day and 200-day MA lines.
Litecoin (LTC) Price Prediction: Are LTC/USDT Buyers Silently Regrouping?
Price action in the Litecoin daily market has witnessed significant price fluctuations recently. Currently, the coin is trading just below the $90.00 mark at the $88.29 price level. This level is significantly above the MA lines, offering some form of support for bullish traders.
Additionally, the 50-day and 200-day MA lines are converging for a bullish crossover, which further brightens bullish hopes. This convergence may mitigate the bearish impact of the downward trend indicated by the Stochastic RSI lines.
Litecoin (LTC) Price Prediction: LTC/USDT Market Seems Preparing to Take Off From the $88 Mark (4-Hour Chart)
In the LTC 4-hour market, price action has fallen just below the 20-day MA line. Other MA lines are below the price action. The latest price candle is hovering just above the $88.00 price level. Meanwhile, the Stochastic RSI lines have reached the oversold region. However, the lines of the indicator have delivered a bullish crossover and appear to be at the initial stage of rising out of that region.
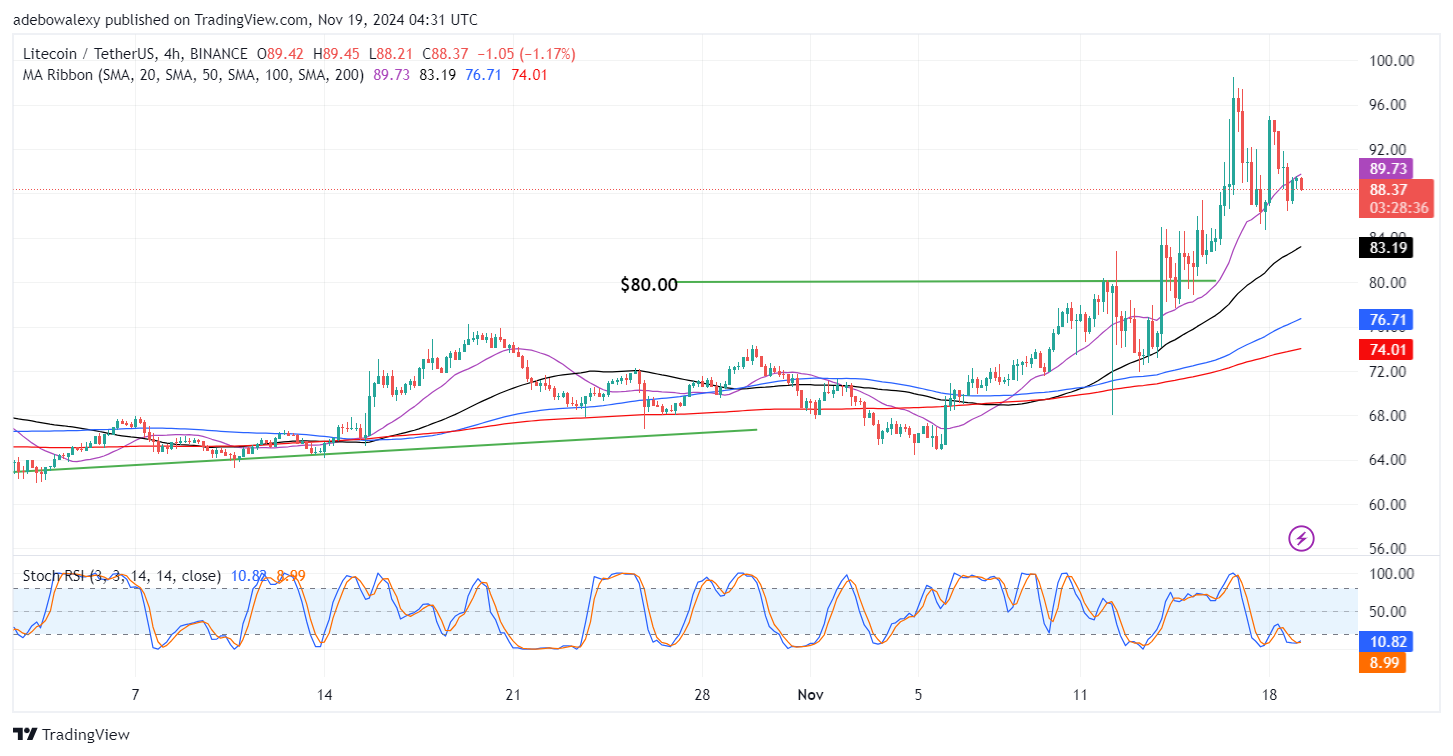
Therefore, the $88.00 price level seems to be a strong support level from which the market may rebound. The Stochastic RSI lines, at the initial stage of rising from the oversold region, suggest that the market may gain traction towards the $95.00 price level.