Wall Street Memes (WSM) Trade Holds On, Buyers Stay Poised
Estimated Reading Time: 3 minutes
Don’t invest unless you’re prepared to lose all the money you invest. This is a high-risk investment and you are unlikely to be protected if something goes wrong. Take 2 minutes to learn more

Wall Street Memes Price Prediction – August 17
WSM’s trade structure demonstrates ongoing resilience, and buying momentum continues to build; while broader dynamics validate accumulation, long-term investors are supported by technical indications that encourage strategic holding, as WSM/USD market buyers remain poised.
In alignment with USD market positioning, the Wall Street Memes chart demonstrates a decisive technical framework where bearish dominance continues to falter. Reinforced support channels, combined with accelerating demand pressures, highlight a diminishing downside outlook, paving the way for a robust bullish drive.
WSM/USD Market
Key Levels
Resistance levels: $0.0008, $0.0009, $0.001
Support levels: $0.0005, $0.0004, $0.0003
WSM/USD – 4-hour Chart
The WSM/USD market’s medium-term chart demonstrates the crypto-economic trade holds on a structure, as buyers stay poised.
The Bollinger Bands, particularly at the midline axis, are reflecting sustained consolidation activity, where recurrent price oscillations within narrowing volatility corridors are progressively structuring decisive support-resistance thresholds that may define the next directional breakout. The stochastic oscillators’ retreat into oversold territory strongly underscores rising bullish preparedness for an imminent upside reversal.
Is the WSM/USD market forming decisive thresholds at the Bollinger Bands’ midline consolidation?
The WSM/USD market is consciously aligning its technical bearings as midline consolidation strengthens, and position staking remains prudent, enabling investors to arrange entries with emerging thresholds and prepare for decisive bullish continuations, while prevailing trade dynamics reinforce structural price stability that keeps buyers firmly poised.
The stochastic oscillators in the WSM/USD market highlight fading bearish conviction as upward reversals gain momentum; this psychological shift reinforces collective investor confidence, supporting disciplined holding strategies that align with long-term accumulation objectives and position purchasers for sustained bullish advantages.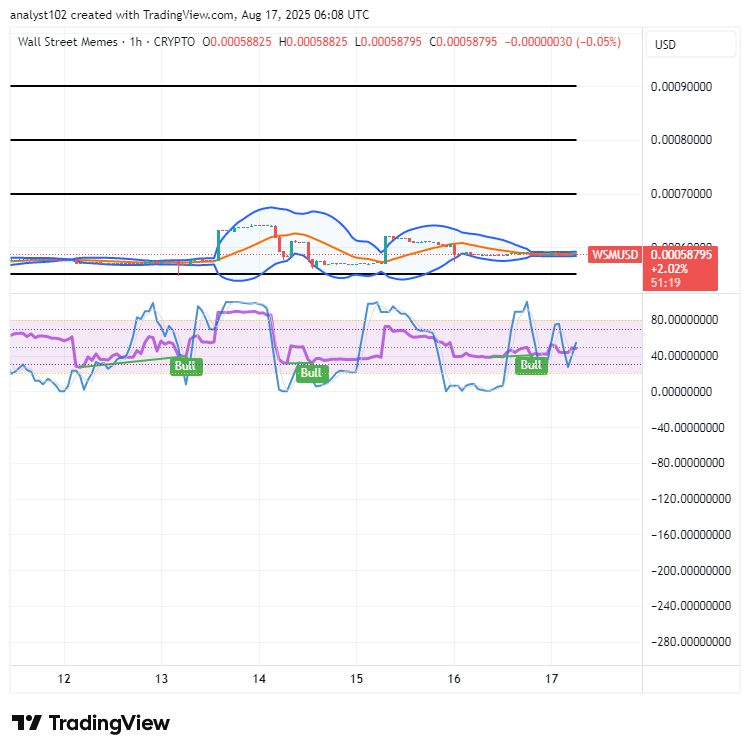
WSM/USD 1-hour chart
The 1-hour chart of the WSM/USD trade holds a structure, as buyers stay poised firmly.
The Bollinger Bands have closely conjoined around $0.0006, indicating that sideways volatility-driven price movement is ongoing. The stochastic oscillators have been persistently swerving up and down, grounding on a formidable bullish threshold.
$WSM community, we saw your Tweets and massive support! 👏
$WSM/$USDT is now officially tradeable on #Bybit Perpetuals with enhanced liquidity access.
$WSM community, we saw your Tweets! 👏$WSM / $USDT is now tradeable on #Bybit Perpetuals.
— Bybit (@Bybit_Official) October 13, 2023
Trade here: https://t.co/le4XyVyXaZ
Also want your project listed? Share your suggestions here:https://t.co/W7EWJVVNV5 https://t.co/XgXoL7g0rF