Wall Street Memes (WSM) Price Strikes Base, Fuels Rebound
Estimated Reading Time: 3 minutes
Don’t invest unless you’re prepared to lose all the money you invest. This is a high-risk investment and you are unlikely to be protected if something goes wrong. Take 2 minutes to learn more

Wall Street Memes Price Prediction – August 16
The Wall Street Memes market versus the business economic values of the US dollar has had a setup to signal a stabilization phase that is fostering renewed buying interest, given that the price strikes a baseline and fuels a rebound.
The Wall Street Memes market, measured against the US dollar’s business-economic dynamics, exhibits technical posture indicative of waning bearish control. Price stabilization at the baseline, coupled with renewed accumulation pressures, suggests downside momentum is nearing exhaustion, with bullish resurgence likely to dominate forthcoming trading sessions.
WSM/USD Market
Key Levels
Resistance levels: $0.0008, $0.0009, $0.001
Support levels: $0.0005, $0.0004, $0.0003
WSM/USD – 4-hour Chart
Today’s WSM/USD market’s medium-term chart shows the crypto-economic price strikes a base, fueling a rebound in the settling of the business proceeds.
At this analysis juncture, the stochastic oscillators’ retreat into oversold territory underscores rising bullish preparedness for an imminent upside reversal. The Bollinger Bands’ measured expansion defines a constrained volatility channel, with resistance stationed near $0.0007 and supportive footing established marginally above $0.00055.
Is WSM/USD Bullish Momentum Forming as Oscillators Reach Oversold and Bollinger Bands Widen?
Yet, long-term base holders of Wall Street Memes coin against the American currency should exercise patience, as sustained accumulation and disciplined position-staking remain key to maximizing gains, given that the price has struck a base, fueling a rebound amid the settling of business proceeds.
As practically demonstrated by technical indicators, the WSM/USD market structure reflects early bullish undercurrents, with oversold oscillator readings and gradual Bollinger Band expansion implying a potential upward shift.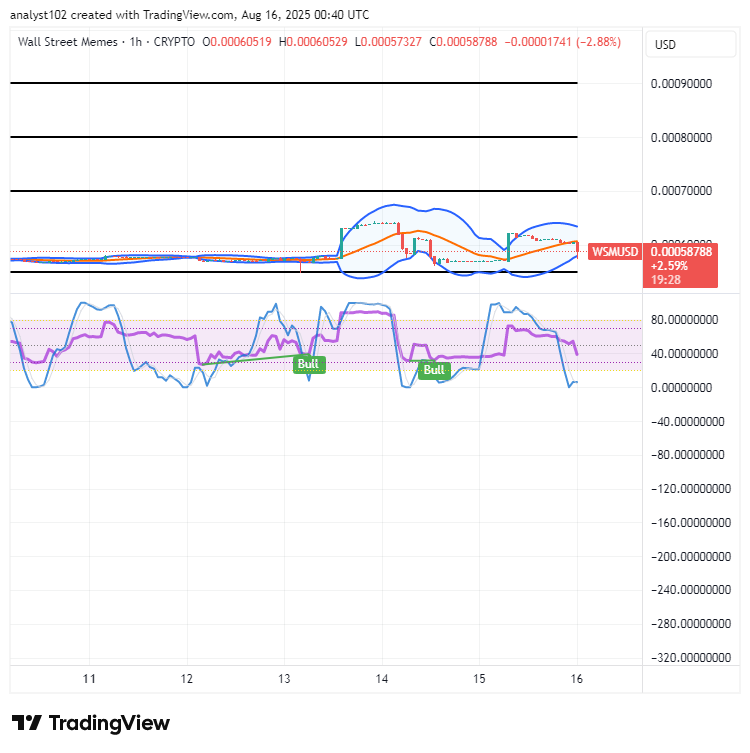
WSM/USD 1-hour chart
The 1-hour chart of the WSM/USD market strikes base, fueling a rebound in its moving style.
The stochastic oscillators have descended into the oversold region, signaling that shorting momentum is progressively diminishing, while the Bollinger Bands are aligned to tentatively outline a structure offering favorable lower entry points for long positions.
Here’s a paraphrased version with 2–4 extra words added:
🚨 WARNING ALERT 🚨
we DO NOT operate any support accounts
we DO NOT run airdrop assist accounts
If you have lost funds, please stay extra aware when posting comments, as you may easily become a target.
🚨 WARNING 🚨
— Wall Street Memes (@wallstmemes) October 12, 2023
we DO NOT have support accounts
we DO NOT have airdrop assist accounts
If you have lost funds, please be aware when posting comments as you may be a target.
Stay tuned for updates here or Telegram ➡️https://t.co/eXtAVhy6xU pic.twitter.com/7nx9dk1pge