Litecoin (LTC) Price Prediction: LTC/USDT Registers a Downward Rejection at $100
Estimated Reading Time: 2 minutes
Don’t invest unless you’re prepared to lose all the money you invest. This is a high-risk investment and you are unlikely to be protected if something goes wrong. Take 2 minutes to learn more

Date: October 14, 2025
Following the heavy market crash that occurred recently, the Litecoin market has been posting a modest recovery over the past few days. However, as soon as price action tested the $100 level, the market experienced another moderate downward rejection.
Key Price Levels
Resistance: $100, $110, $130
Support: $95, $90, $85
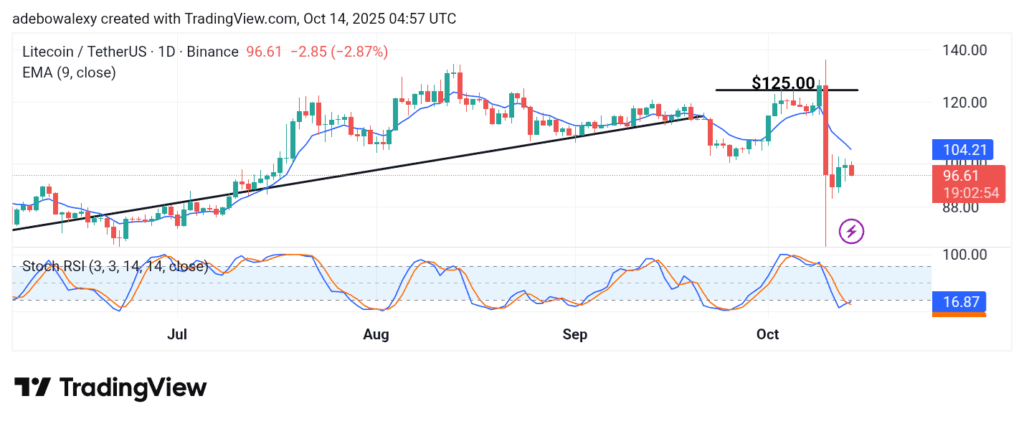
Litecoin’s price action has recently shown steady recovery from the previous sudden crash. The recovery has spanned four sessions in general. However, the ongoing session has delivered a moderate dip toward lower price levels. This keeps the market below the 9-day Exponential Moving Average (EMA) line. Meanwhile, the Stochastic Relative Strength Index (SRSI) lines maintain an upward crossover in the oversold region.
Litecoin (LTC) Price Prediction: LTC/USDT Stays in Bearish Territory
Based on Litecoin’s daily market activity, it can be said that price action remains subdued as traders observe how the ongoing session unfolds.
The latest price candle is a bearish one, causing the market to dip further while remaining below the 9-day EMA curve. However, the lines of the SRSI indicator remain steady as they display an upward crossover.
Be that as it may, the fact that these lines remain in the oversold region suggests that price activity is still under bearish sentiment.
Litecoin (LTC) Price Prediction: LTC/USDT Seems Set for More Declines (4-Hour Chart)
By scaling down to the 4-hour Litecoin market, one can see that price action is taking a bearish turn. Here, price activity has crossed below the 9-day EMA curve in the ongoing session.
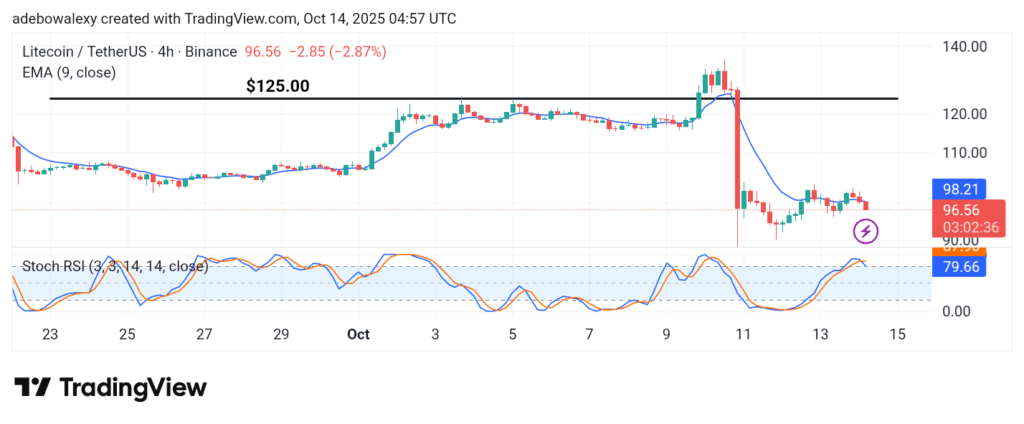
At the same time, the lines of the SRSI indicator have just completed a downward crossover in the overbought region. The ensuing lines can be seen moving downward following this crossover. Therefore, the bears are prevailing and may drive the market toward the $93 price level.