Litecoin (LTC) Price Prediction: LTC/USDT Hits a Wall at $125
Estimated Reading Time: 2 minutes
Don’t invest unless you’re prepared to lose all the money you invest. This is a high-risk investment and you are unlikely to be protected if something goes wrong. Take 2 minutes to learn more
Date: October 7, 2025
The Litecoin market has experienced a significant upside recovery from its latest steep dip. The market now trades above the drawn trend line despite the rejection it faced after testing resistance at the $125 price mark.
Key Price Levels
Resistance: $120, $125, $130
Support: $115, $110, $105
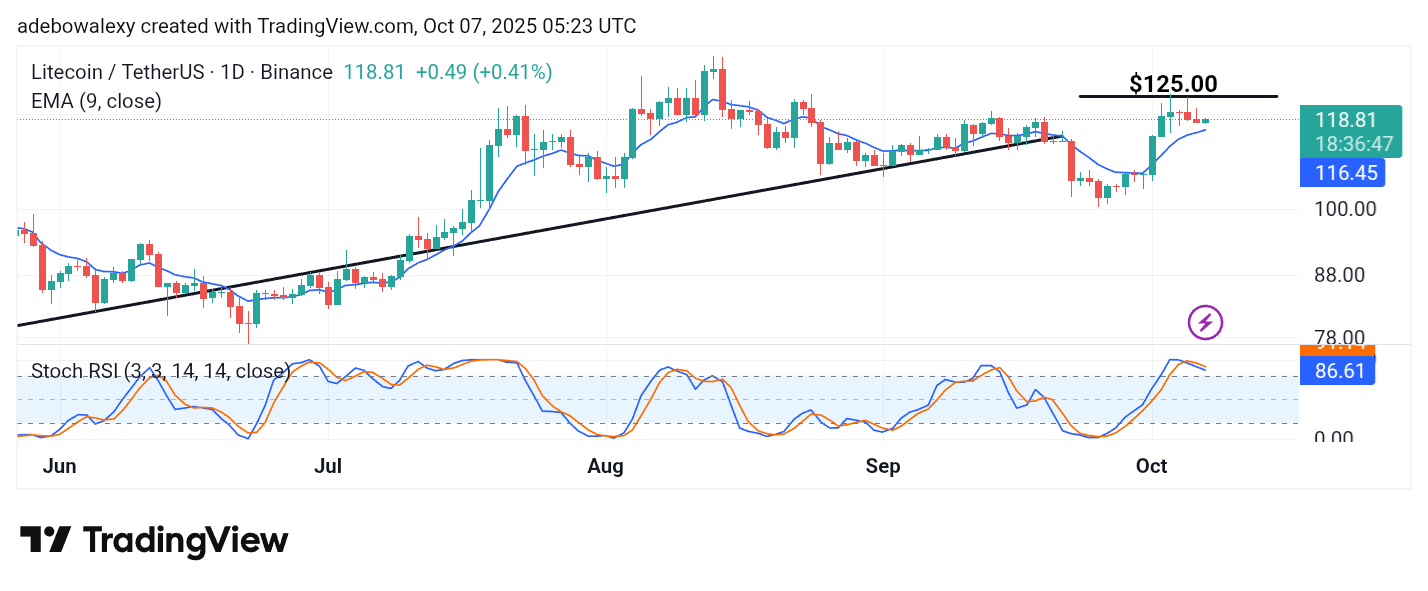
Price action in the Litecoin daily market has resurfaced above the $115 mark. However, the market faced rejection at the $125 price level. Nevertheless, trading continues above the 9-day Exponential Moving Average (EMA) line. Also, the Stochastic Relative Strength Index (SRSI) indicator lines remain above the 80 mark. However, the latter part of these lines shows a slight downward movement toward the 80 level.
Litecoin (LTC) Price Prediction: LTC/USDT Buyers Exercise Caution
After price action on the Litecoin daily chart bounced off resistance at the $125 price level, movement has been largely sideways. The latest price candle on this chart is green but shows only a very small price increase.
Albeit its position above the 9-day EMA curve suggests there is still hope for a potential continuation of the upward trend.
The trajectory of the SRSI indicator lines reflects a cautious market mood as they slightly descend toward the 80 mark. Nevertheless, upside momentum remains possible as price action stays above the 9-day EMA curve.
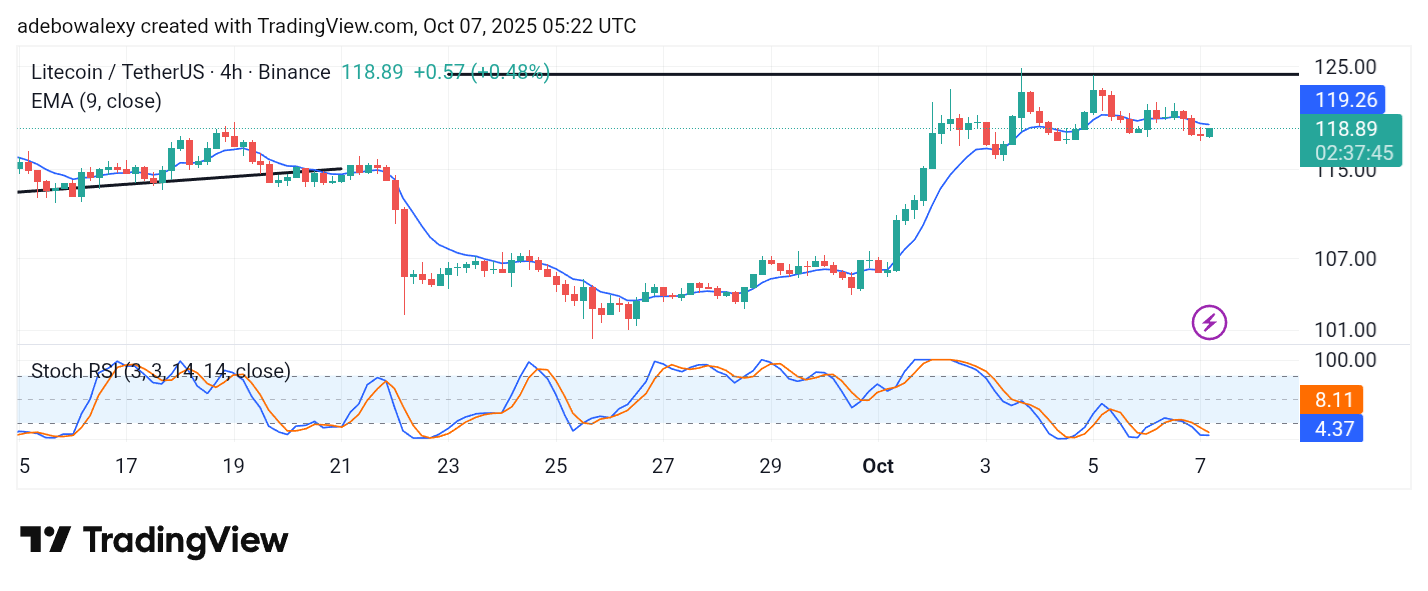
Litecoin (LTC) Price Prediction: LTC/USDT Aims to Resurface Above the EMA Curve (4-Hour Chart)
Similar to what is observed on the daily chart, the last price candle on the 4-hour chart is also green. However, price action has pulled back below the 9-day EMA curve. At the same time, the SRSI indicator lines are now in the oversold region and are converging at their terminal point.
This convergence aligns with the appearance of the latest price candle.
Given that the recent price candle sits just below the 9-day EMA curve, a bullish crossover in the SRSI indicator lines could help price action move back above the EMA line. This would strengthen bullish sentiment, and traders may begin targeting the $125 mark once again.