Litecoin (LTC) Price Prediction: LTC/USDT Upside Recovery Faces Modest Rejection
Estimated Reading Time: 2 minutes
Don’t invest unless you’re prepared to lose all the money you invest. This is a high-risk investment and you are unlikely to be protected if something goes wrong. Take 2 minutes to learn more

Date: September 29, 2025
After price action on the Litecoin daily chart breached support at the $110 level, a weak upward correction began. However, this upward move has since been challenged at a key technical level. The ongoing session suggests a modest rejection.
Key Price Levels
Resistance: $110, $115, $120
Support: $105, $100, $95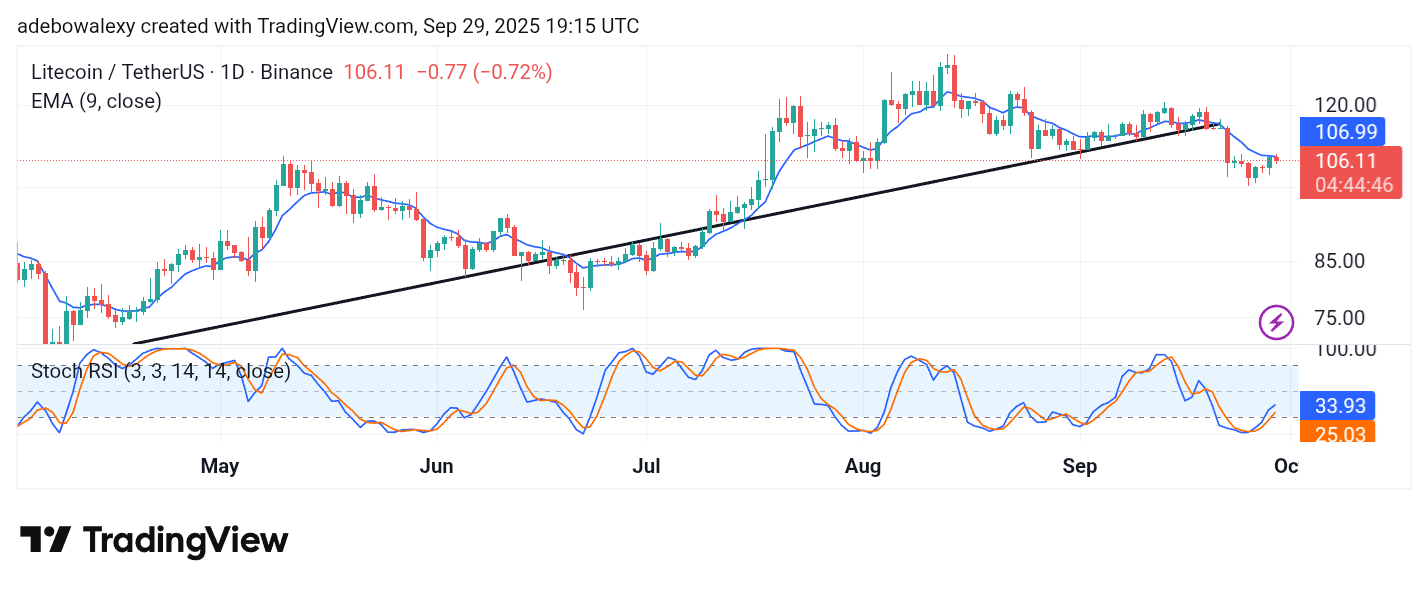
Price action is hovering just below the 9-day Exponential Moving Average (EMA) line, after rebounding earlier from near the $100 mark. The latest price candle on the daily chart appears red and below the 9-day EMA curve. Meanwhile, the Stochastic Relative Strength Index (SRSI) lines are still rising from the oversold region. The lead line shows a deflection in response to the ongoing session.
Litecoin (LTC) Price Prediction: LTC/USDT May Maintain an Upward Path Despite Minor Rejection
Although price activity on the Litecoin daily chart remains below the 9-day EMA line, the overall upward movement still appears intact. The ongoing session shows a rebound off the 9-day EMA curve, though the rebound seems minimal compared to the stronger gains recorded in the previous session.
The SRSI indicator lines continue to progress upward from the oversold region, suggesting that the broader trend may withstand the temporary rejection seen in the current session.
Litecoin (LTC) Price Prediction: LTC/USDT Market May See an Upward Leap (4-Hour Chart)
In the 4-hour chart, Litecoin price movement has risen above the 9-day EMA line. However, the current session still retains a bearish appearance, with the latest price candle standing above the EMA curve but showing pronounced upper and lower shadows, signaling tension in the market.
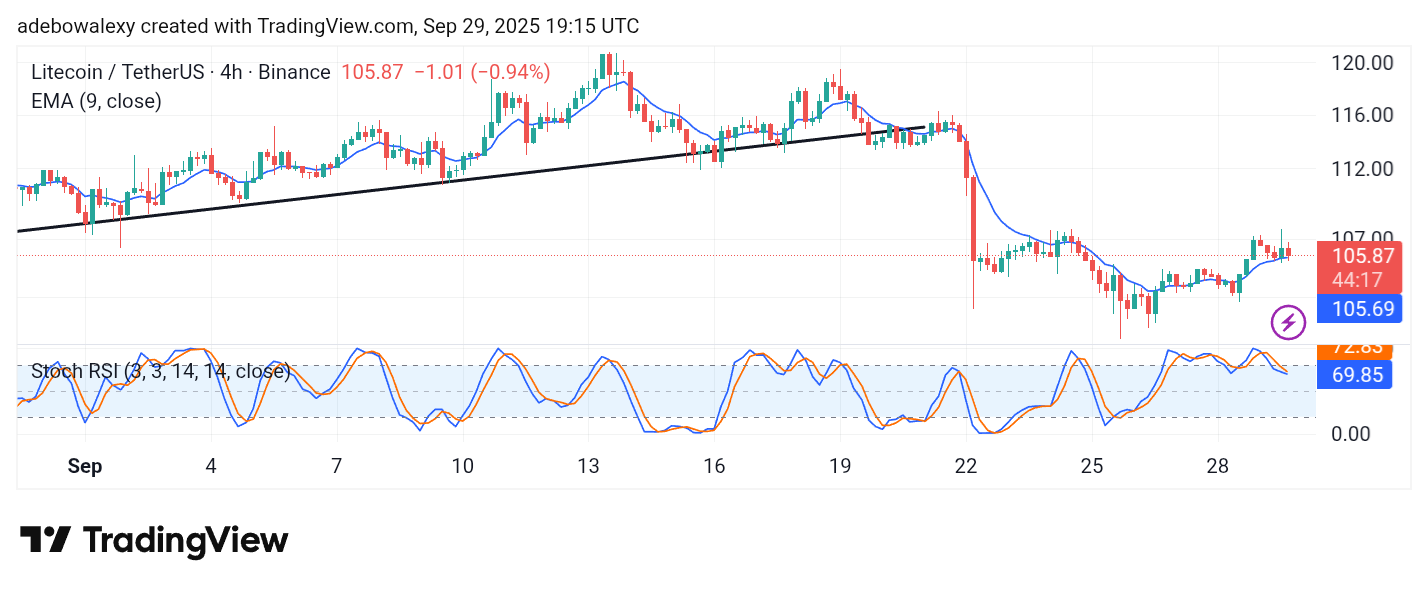
The SRSI lines are converging despite their recent descent, which technically suggests a possible bullish crossover. If this occurs, it could support an upward move toward the $110 price level.