Litecoin (LTC) Price Prediction: LTC/USDT Races Toward the $100 Support Mark
Estimated Reading Time: 2 minutes
Don’t invest unless you’re prepared to lose all the money you invest. This is a high-risk investment and you are unlikely to be protected if something goes wrong. Take 2 minutes to learn more

Date: September 23, 2025
Headwinds have gained the upper hand in the Litecoin market recently. This has triggered a strong downward movement in the market. At this point, the market is predisposed to further decline.
Key Price Levels
Resistance: $110, $115, $120
Support: $100, $95, $90
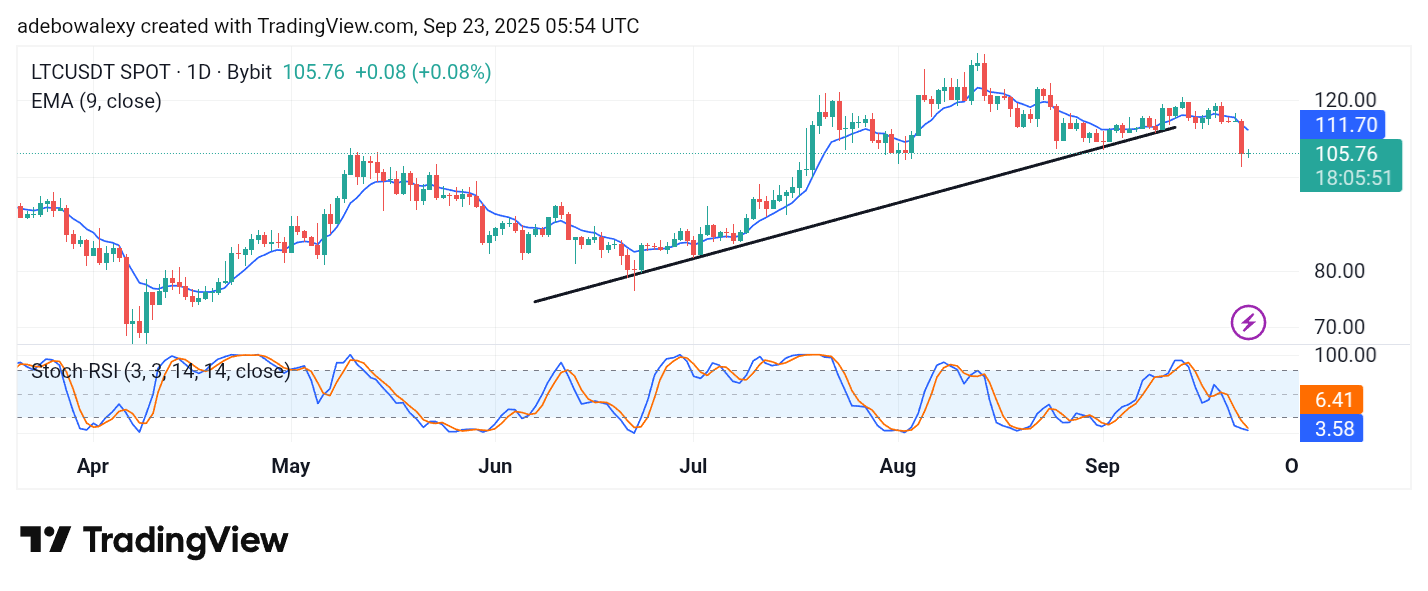
The Litecoin market crashed below the 9-day Exponential Moving Average (EMA) line in the previous session. Since then, price action has remained below the line. The candles of the ongoing session appear green but remain compressed under the 9-day EMA curve. Meanwhile, the Stochastic Relative Strength Index (SRSI) lines can still be seen pointing toward the lower boundary of the oversold region, despite showing signs of convergence.
Litecoin (LTC) Price Prediction: LTC/USDT Looks Overwhelmed
With the strong downward retracement in the previous session, bulls in the Litecoin daily market appear overwhelmed. The latest price candle on the chart remains compressed under bearish influence, keeping price action below the 9-day EMA curve.
At the same time, the SRSI indicator lines continue their trajectory deeper into the oversold region. Technically, applied trading indicators are strongly hinting at a continued downward movement in this market.
Litecoin (LTC) Price Prediction: LTC/USDT Upside Movement Faces a Challenge (4-Hour Chart)
The Litecoin market on the 4-hour chart shows that price action has seen minimal upside retracement. However, the ongoing session carries a negative impulse. As can be seen, the latest price candle on this chart is red.
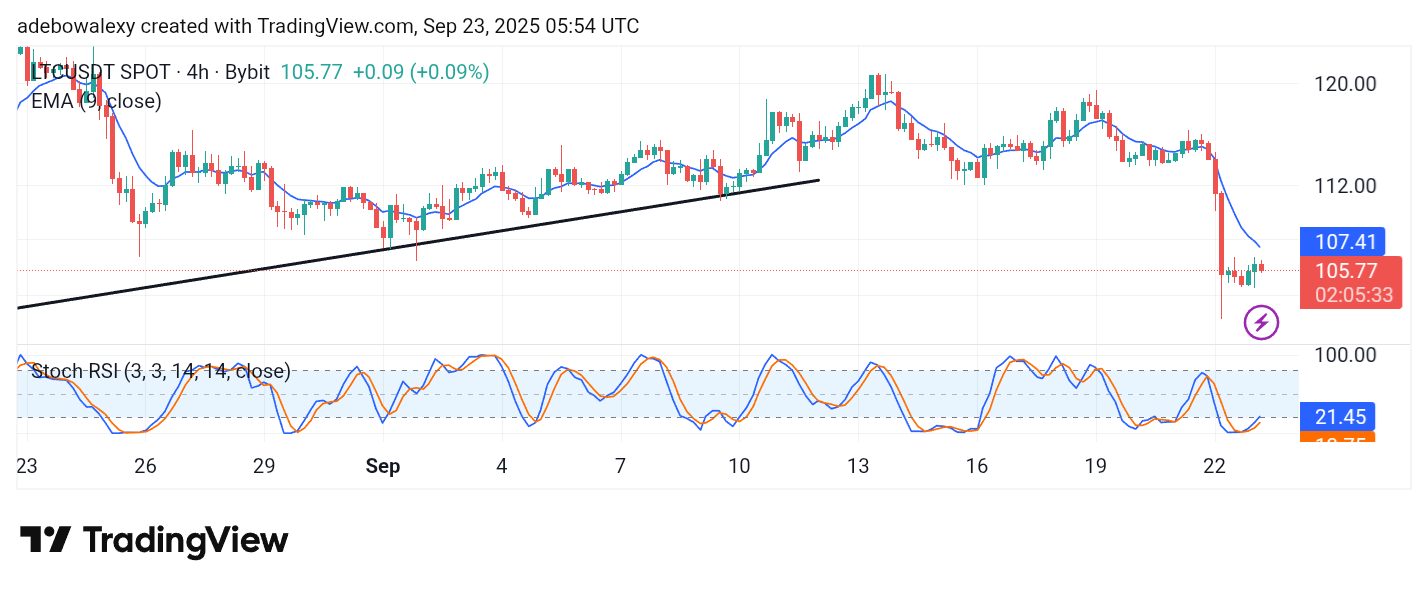
Price action remains below the 9-day EMA line, and as such, it signals the possibility of the downward retracement extending further. The SRSI lines, however, maintain an upward trajectory from the oversold region. Nevertheless, since price action is already succumbing to bearish pressure below the 9-day EMA, a continued downward correction toward the $100 mark seems likely.