Ethereum (ETH/USD) Trade Hovers Beneath Bearish a Trend Line
Estimated Reading Time: 3 minutes
Don’t invest unless you’re prepared to lose all the money you invest. This is a high-risk investment and you are unlikely to be protected if something goes wrong. Take 2 minutes to learn more

Free Crypto Signals Channel
Ethereum Price Prediction – March 14
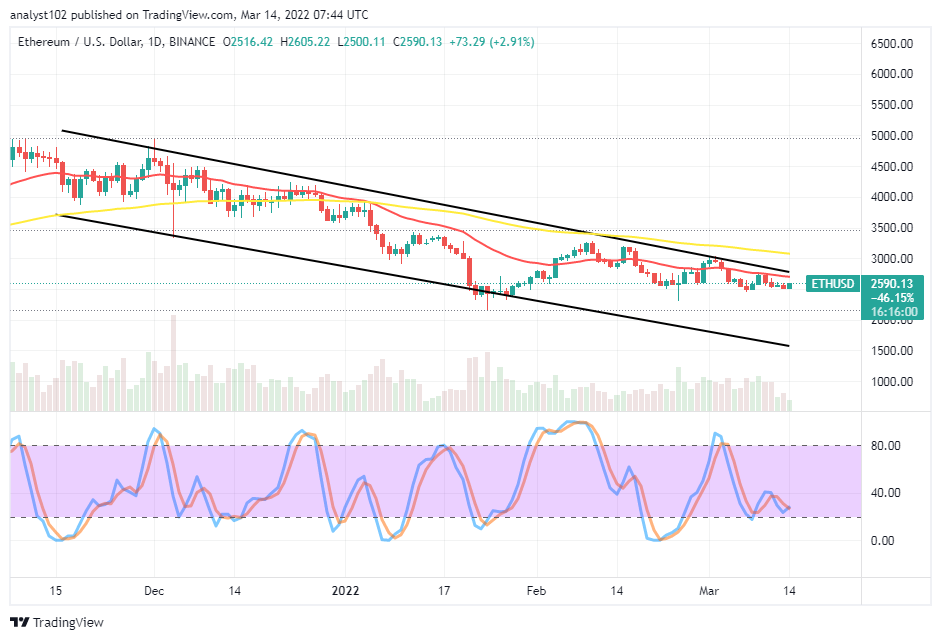
It observed that the ETH/USD trading activities have been witnessing variant ups and downs to attest the crypto-economic trade hovers beneath the upper bearish trend line. Price has initially sprung from a low of around $2,500 to a high of $2,605 at a positive percentage of 2.91.
ETH/USD Market
Key Levels:
Resistance levels: $2,750, $3,000, $3,250
Support levels: $2,250, $2,000, $1,750
ETH/USD – Daily Chart
The ETH/USD daily chart showcases the crypto-economic trade hovers beneath the upper bearish trend line drew in an extension a bit above the smaller SMA trend line. The 50-day SMA indicator is above the 14-day SMA indicator. The Stochastic Oscillators have been in the ranges of 40 and 20 over a couple of days. And they now attempt to cross northbound, indicating that a buying force is ongoing.
Will the current buying force pushes higher more as the ETH/USD trade hovers beneath the upper bearish trend line?
An indication suggesting the ETH/USD market may push higher for recoveries presently as the crypto-economic trade hovers beneath the bearish trend line drawn. Long-position placers have to be cautious of their entries. Less-active motion around a higher resistance, using the 4-hour chart or the 1-hour chart, a warning signal against getting sustainable moves may spot after a while. In the slow-and-steady movements to the upside, price may eventually push into the resistances of $2,750 and $3,000 once again.
On the downside of the technical analysis, the ETH/USD trade short-position placers are to be on the lookout for higher pushes to encounter rejections around the 14-day SMA trend line before considering a launch of sell order afterward. A sudden reversal against the current buying force will potentially lead the crypto economy into finding a lower support line a bit below the $2,500 in the long run. Traders should be wary of following the trend to the downside when that assumption is playing out.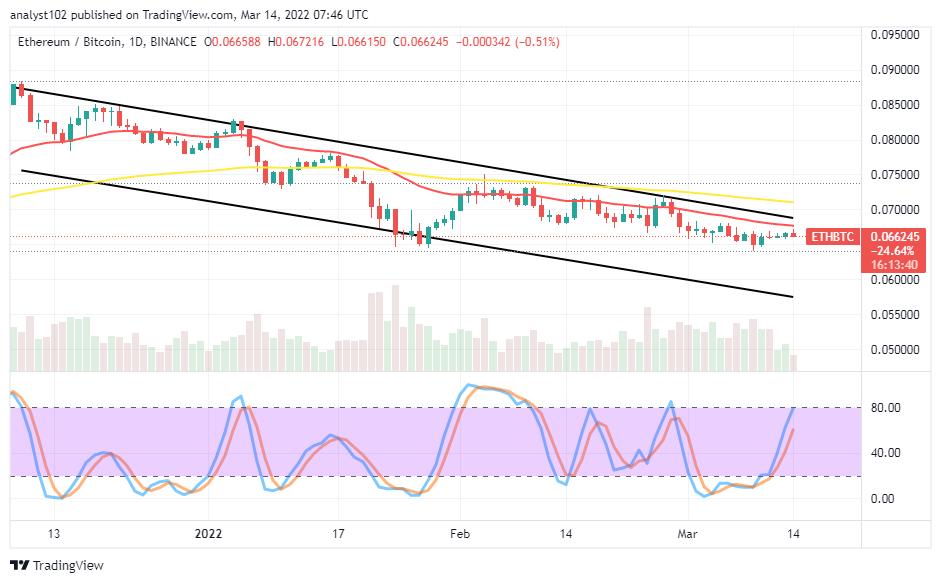
ETH/BTC Price Analysis
In comparison, Ethereum’s capacity trends are under falling pressure as placed side by side with Bitcoin. The cryptocurrency pair trade hovers underneath the upper bearish trend line drawn and the smaller SMA. The 50-day SMA indicator is above the 14-day SMA indicator. The Stochastic Oscillators have swerved northbound closely to the range of 80. That signifies the base crypto is striving to push for momentum against its flagship countering crypto. However, the force to back the presumed upward moves appears less weighty than the downward.
Note: Cryptosignals.org is not a financial advisor. Do your research before investing your funds in any financial asset or presented product or event. We are not responsible for your investing results.
You can purchase Lucky Block here. Buy LBlock: