Toncoin (TON/USD) Reclaims Momentum, Eyes Return to $3.60
Estimated Reading Time: 3 minutes
Don’t invest unless you’re prepared to lose all the money you invest. This is a high-risk investment and you are unlikely to be protected if something goes wrong. Take 2 minutes to learn more

Toncoin (TON/USD) recently made an attempt to hold above the $3.40 support level and push past the $3.60 resistance. However, the rally stalled at the $3.60 mark, triggering profit-taking that pulled the price back below $3.40—effectively turning the level into a short-term resistance.
In today’s trading session, TON has surged once again, breaking back above the $3.40 level. If the price can sustain this upward move, the market may be setting the stage for another attempt at the $3.60 resistance zone.
Toncoin (TON/USD) Market Data
- TON/USD Price Now: $3.44
- TON/USD Market Cap: $8.2 billion
- TON/USD Circulating Supply: 2.4 billion TON
- TON/USD Total Supply: 5 billion TON
- TON/USD CoinMarketCap Ranking: #19
Key Levels
- Resistance: $3.50, $4.00, and $4.50
- Support: $3.00, $2.50, and $2.00
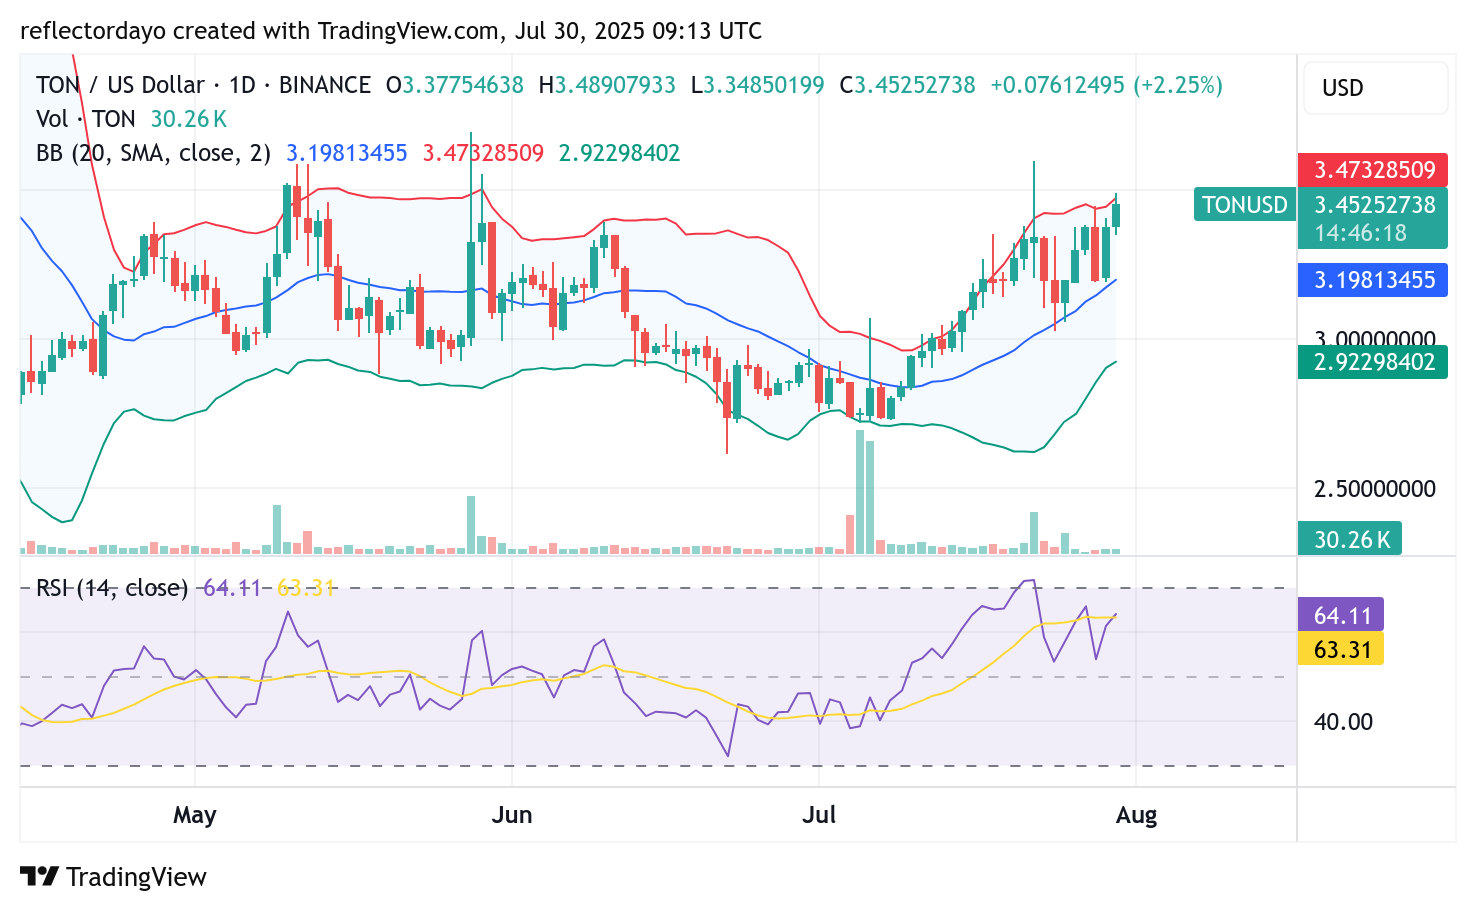
Toncoin (TON/USD) Technical Outlook: Price Pulls Back Near $3.50 as Momentum Falters
In today’s trading session, Toncoin (TON/USD) surged upward, aiming to revisit its previous high of $3.60. However, the market encountered resistance near the $3.50 level, triggering a pullback as bearish sentiment emerged.
This reaction suggests that traders are closely watching the $3.50 zone for signs of selling pressure. A minor correction has followed the price’s approach to this level, reflecting cautious sentiment. Although the market is still holding its ground above $3.40, the low trading volume—evident in shrinking histogram bars—indicates that a sustained push beyond $3.50 and toward $3.60 may be unlikely in the short term unless buying momentum begins to build.
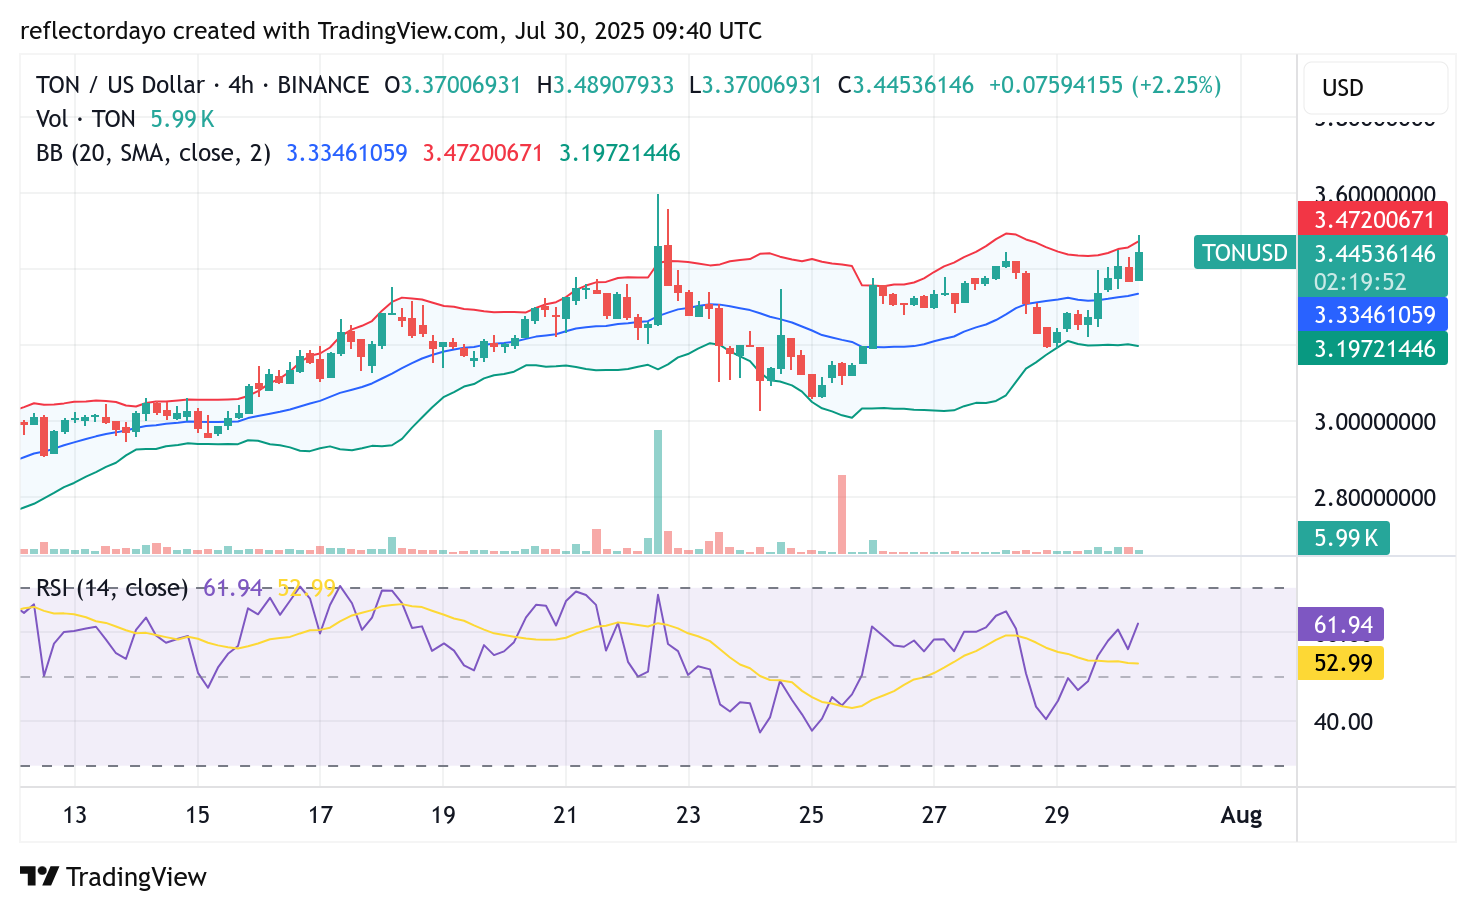
TON/USD 4-Hour Chart Analysis: Bulls Defend Key Support Amid Heightened Volatility
A closer look at the 4-hour chart shows Toncoin (TON/USD) attempting to establish a higher support level around $3.37—just below the critical $3.50 resistance zone. Bulls are currently working to keep the price above the $3.40 mark, reinforcing short-term support.
However, the Bollinger Bands remain widely spread, indicating elevated market volatility and the potential for a sharp price move—possibly to the downside if bullish momentum weakens. Similar to the daily chart, trading volume remains subdued, as reflected in the low-height histogram bars, suggesting that strong conviction from either side has yet to emerge.