Quant Price Prediction: QNT/USD Swings Above $111 Resistance
Estimated Reading Time: 3 minutes
Don’t invest unless you’re prepared to lose all the money you invest. This is a high-risk investment and you are unlikely to be protected if something goes wrong. Take 2 minutes to learn more
Quant Price Prediction – January 5
The Quant price prediction shows that QNT may restart the uptrend after touching the daily high of $116.25.
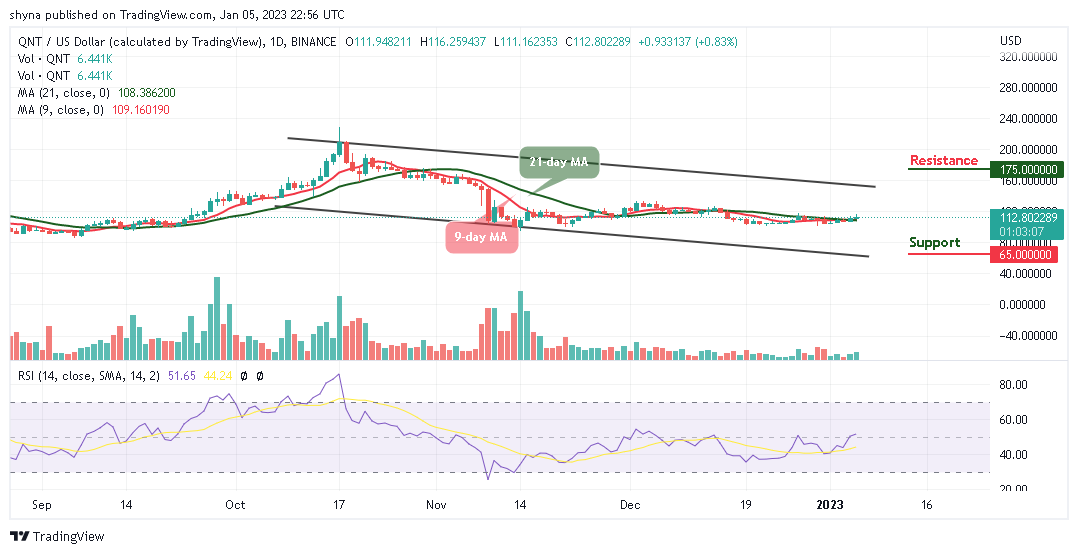
QNT/USD Long-term Trend: Ranging (Daily Chart)
Key levels:
Resistance Levels: $175, $195, $205
Support Levels: $65, $45, $25
QNT/USD looks green today as the price hovers above the 9-day and 21-day moving averages. However, a bullish movement toward the upper boundary of the channel may increase the Quant price to the resistance level of $130. Nevertheless, traders should note that a consistent price increase could bring more buyers into the market as bulls increase their positions.
Quant Price Prediction: Price May Initiate a Price Hike
According to the daily chart, after the Quant price touches the daily high of $116.25, the first digital asset is now looking forward to touching another resistance level of $120. Therefore, if the red line of the 9-day moving average crosses above the green line of the 21-day moving average, this will keep the coin on the positive side.
On the contrary, bears may bring the market price back below the 9-day and 21-day moving averages if the bulls fail to push it to the upside. Meanwhile, the technical indicator Relative Strength Index (14) is crossing above the 50-level which could take the king coin to the resistance levels of $175, $195, and $205 but if the market price retreats and move towards the lower boundary of the channel, it may bring the price to the supports at $65, $45, and $25.
QNT/USD Medium-Term Trend: Ranging (4H Chart)
According to the 4-hour chart, the Quant price is likely to cross below the 9-day and 21-day moving averages as the king coin heads toward the lower boundary of the channel which could reach the support level of $105 and below.
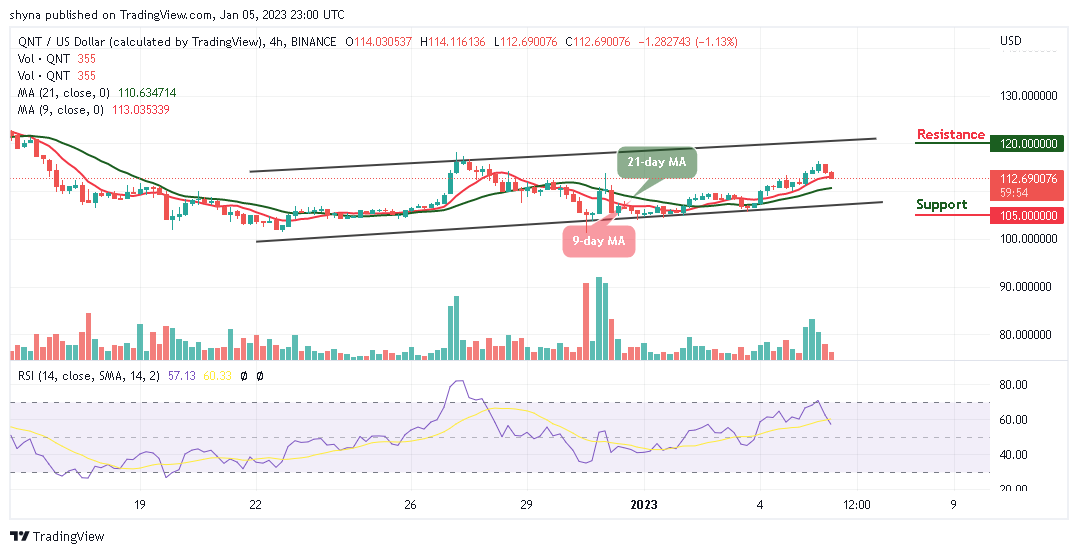
On the other hand, if the buyers push the market price upward, traders can expect a rise toward the upper boundary of the channel, and breaking this barrier could take the price to hit the resistance level of $120 and above. Meanwhile, the technical indicator Relative Strength Index (14) is crossing below the 60-level, suggesting more bearish signals.
Place winning Quant trades with us. Get QNT here