Band Protocol (BANDUSD) Is Set for More Upside Movement
Estimated Reading Time: 3 minutes
Don’t invest unless you’re prepared to lose all the money you invest. This is a high-risk investment and you are unlikely to be protected if something goes wrong. Take 2 minutes to learn more
BANDUSD Analysis – Bulls Set the Market for More Upside After a Retest at $8.600
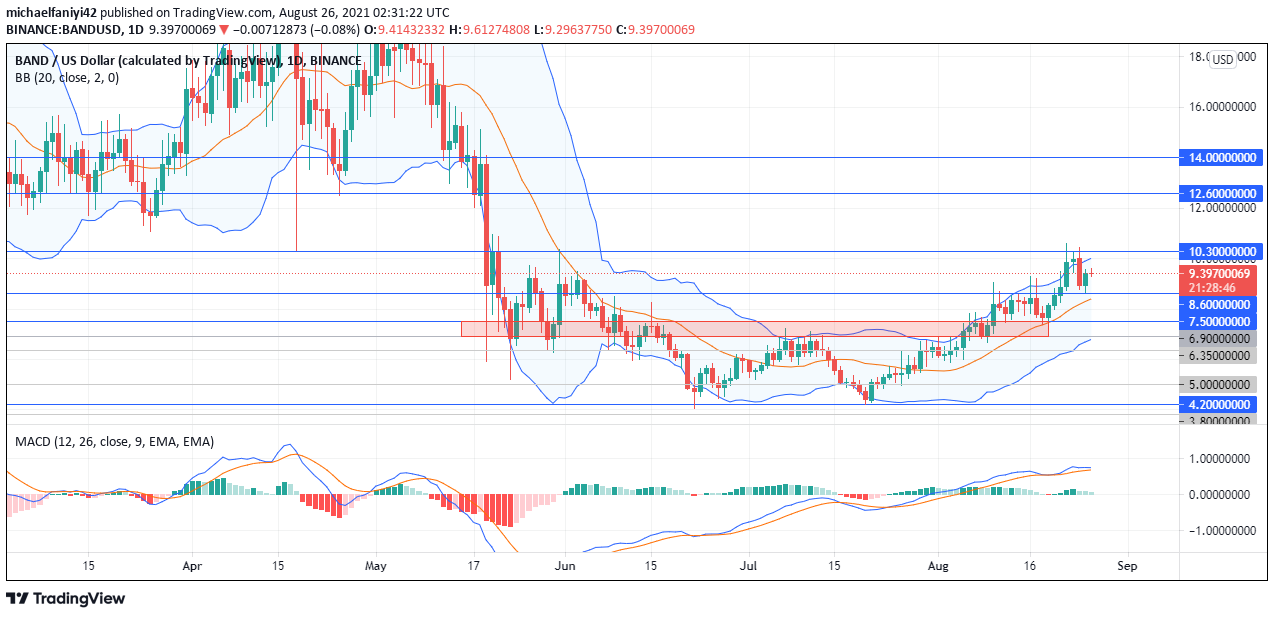
BANDUSD is set for more upside movement after the coin retests the $8.600 key level. The crypto has been making steady progress since it began its uptrend movement from the $4.200 support level. The increase in price which was spread across 35 days, amounted to a 145% increase. Band Protocol is well-positioned to continue its upward movement despite the setback the market is currently facing at the $10.300 resistance.
BANDUSD Key Level
Resistance Levels: $10.300, $12.600, $14.000
Support Levels: $8.600, $7.500, $4.200
The greatest test for the coin in its rally is overcoming the $7.500 key level, a zone that extends to $6.900. The zone has in the past proved to be very hardened support for the market, and at other times, proved to be an obstinate resistance to price also. The coin eventually made it past this zone on the 10th of August 2021, after about 5 days of persistent pushing from the bulls.
Since the coin climbed above the $7.500 key zone, it has been pushed up after a retest of the zone. The bounce took the price directly to the $10.300 price level, where it suffered rejection. BANDUSD has now pulled back to support at $8.600 and is now set for an assault on the $10.300 key level. The middle line of the Bollinger Band is acting as support to keep price. Meanwhile, the Moving Average Convergence Divergence displays bullish histogram bars to indicate that the momentum is still with the buyers.

Market Prospects
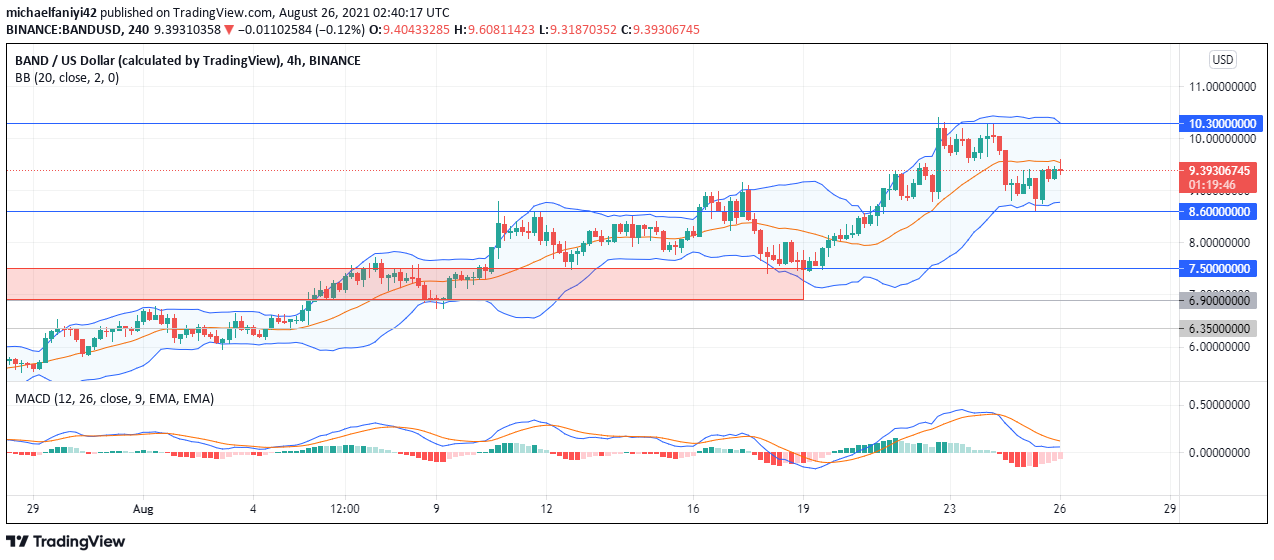
On the 4-hour chart, falling from the $10.300 resistance has made the price trade to the underside of the middle line of the Bollinger Band. Having bounced off the support at $8.600, the markets must first subdue the middle line of the Bollinger Band before going higher to break through $10.300. The MACD shows dwindling bearish histogram chat and we can expect a cross upward from the EMAs of the MACD.
Once the price breaks above $10.300, the next target is at $12.600.
You can purchase crypto coins here: Buy Tokens
Note: Cryptosignal.org is not a financial advisor. Do your research before investing your funds in any financial asset or presented product or event. We are not responsible for your investing results.