Wall Street Memes (WSM) Price Lays On, Catalyst Is Rebuilding
Estimated Reading Time: 3 minutes
Don’t invest unless you’re prepared to lose all the money you invest. This is a high-risk investment and you are unlikely to be protected if something goes wrong. Take 2 minutes to learn more

Wall Street Memes Price Prediction – August 15
Wall Street Memes (WSM) maintains a consistent and promising stance, indicating resilience and gradual value reinforcement, while the crypto base continues to develop a catalyst against the US dollar.
The momentum surrounding Wall Street Memes (WSM) suggests an emerging strength, as underlying market dynamics point toward an impending decline in the US dollar’s capacity to exert sustained upward influence within the competitive crypto economies landscape.
WSM/USD Market
Key Levels
Resistance levels: $0.0008, $0.0009, $0.001
Support levels: $0.0005, $0.0004, $0.0003
WSM/USD – 4-hour Chart
The WSM/USD medium-term chart showcases that the crypto-economic market rests on a baseline, initiating a catalyst-rebuilding cycle output.
The Bollinger Bands have marginally expanded, delineating a trading corridor between resistance near $0.0007 and support slightly above $0.00055. At this analysis point, the stochastic oscillators have retraced southward into oversold territory, indicating mounting bullish readiness for a potential near-term upside reversal.
Is the WSM/USD Market’s Baseline Positioning Signaling the Onset of a Catalyst-Rebuilding Cycle?
The current baseline structure suggests foundational stability in WSM/USD’s market operations, allowing catalysts to mature organically and potentially fostering sustainable upward momentum once market conditions align with developing bullish triggers.
Given this structure, the US dollar, serving as the counter instrument, appears increasingly susceptible to an unprecedented loss of upward driving capacity, as evolving market catalysts in WSM/USD strengthen the probability of a sustained shift in directional control toward bullish dominance.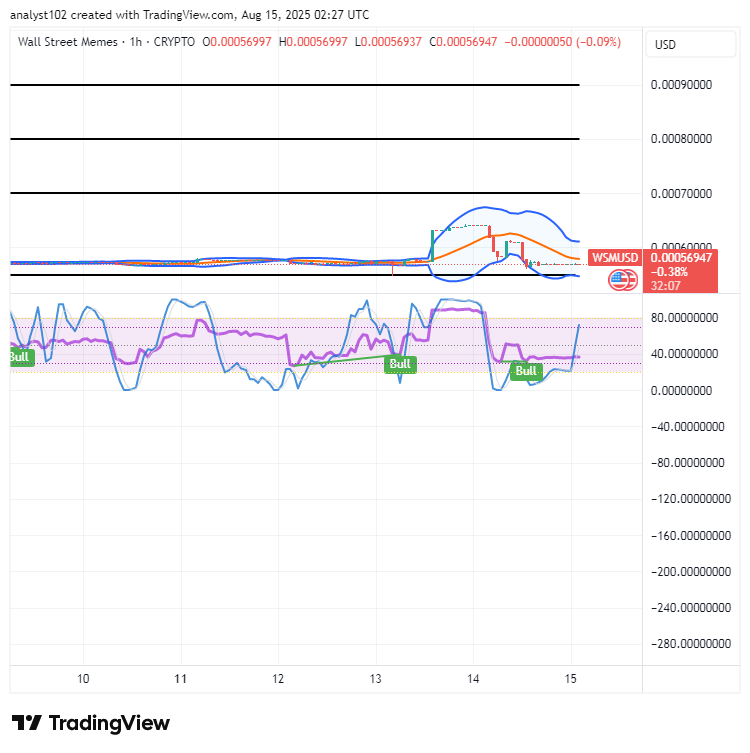
WSM/USD 1-hour chart
The 1-hour chart of the WSM/USD price rests on normal trade baseline zones, with catalysts steadily rebuilding.
The Bollinger Bands are expanding sharply northward, indicating a steady erosion of sellers’ influence. Meanwhile, the stochastic oscillators are rising from deep oversold territory, positioning just below the 80 level and reinforcing the potential for sustained bullish momentum.
$WSM community, we saw your Tweets and excitement! 👏
$WSM/$USDT is now officially tradeable on #Bybit Perpetuals with enhanced global accessibility.
$WSM community, we saw your Tweets! 👏$WSM / $USDT is now tradeable on #Bybit Perpetuals.
— Bybit (@Bybit_Official) October 13, 2023
Trade here: https://t.co/le4XyVyXaZ
Also want your project listed? Share your suggestions here:https://t.co/W7EWJVVNV5 https://t.co/XgXoL7g0rF