Uniswap (UNI/USD) Market Trades Closely Over $6
Estimated Reading Time: 3 minutes
Don’t invest unless you’re prepared to lose all the money you invest. This is a high-risk investment and you are unlikely to be protected if something goes wrong. Take 2 minutes to learn more
Uniswap Price Prediction – January 26
The Uniswap price worth has remained, trading in an an-up-and-down moving mode alongside a bullish path as it currently shows that the crypto market trades closely over the $6 level. There is a minute negative percentage rate of 0.89 in the trading capacity pace of the market as the price is trading around the $6.5333003 value line as of the time of writing this technical analysis. That means the point in the headline will serve a crucial spot, determining further sustainable ups.
UNI/USD Market
Key Levels:
Resistance levels: $7, $7.50, $8
Support levels: $5.50, $5, $4.50
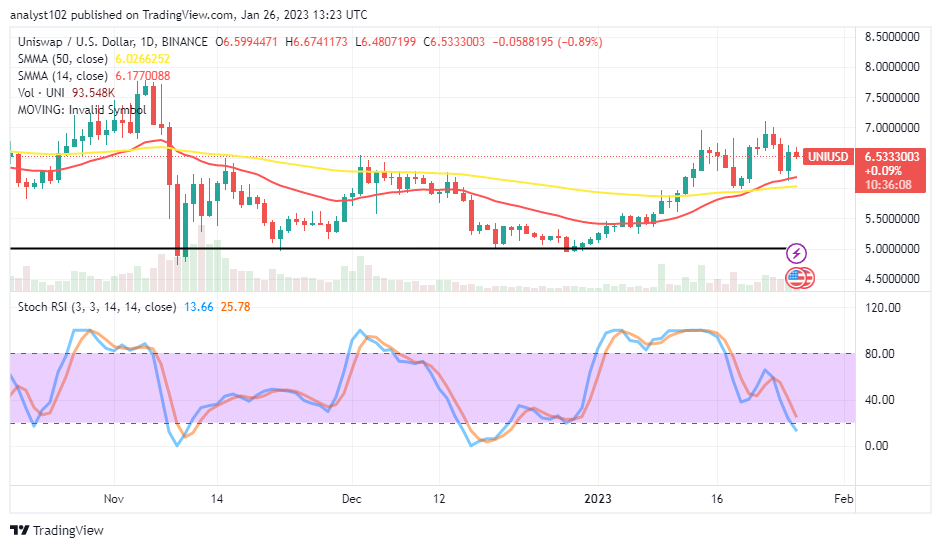
UNI/USD – Daily Chart
The UNI/USD daily chart showcases that the crypto market trades closely over the $6 level above the closely above buy signal side of the SMAs. The 14-day EMA indicator is at $6.1770088 over the $6.0266252 point of the 50-day SMA indicator. The Stochastic Oscillators have crossed southbound from the 60 through variant levels to position at 25.78 and 13.66. That signifies the former trading instrument is yet to decide when to surge visibly against the US Dollar currency.
Will the UNI/USD trade bulls continue to trade above the SMAs?
As the UNI/USD market activity trades closely over the $6 level to show bears are yet to make a quick comeback against those value lines. Yesterday’s session eventually generated a bullish candlestick to set a wall-trading pace near above the 14-day SMA for buyers to use as a yardstick to determine their longing order entry. If that assumption is anything to go by, support around the point mentioned earlier must not breach southward against stably at any point in time.
On the decrease-moving side of the technical analysis, the UNI/USD market bears are to let the reading of the Stochastic Oscillators suggest either a higher-trading zone coupling a point toward the downside or a total overbought condition supported with the emergence of a formidable active-trading bearish candlestick to count their shorting order execution upon afterward. That sentiment may play out in the long run between $7 and $7.50.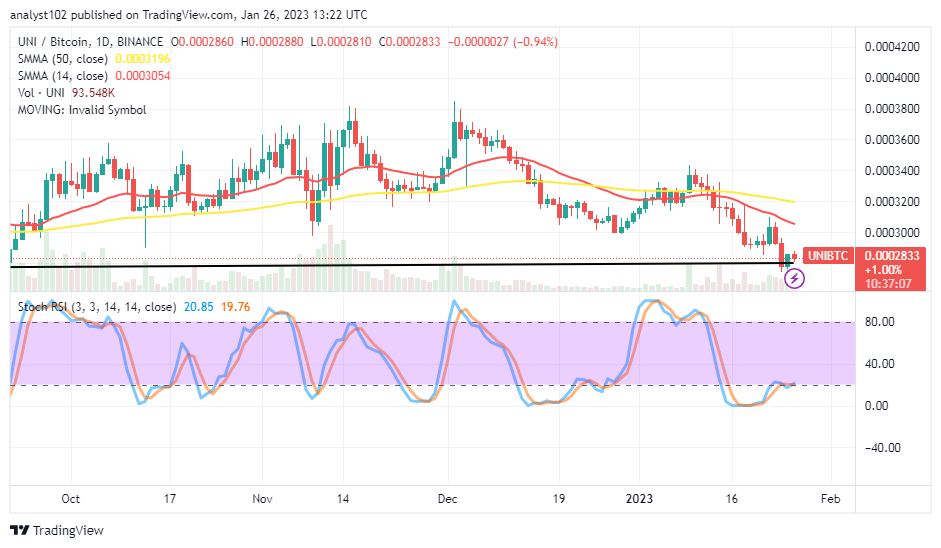
UNI/BTC Price Analysis
In comparison, Uniswap has remained to strive to rebuild a baseline around the horizontal line drawn beneath the SMA trend lines against the trending capacity worth of Bitcoin. As of writing, the pairing cryptocurrency price trades closely over the horizontal line. The Stochastic Oscillators have been trying to swing their lines northbound from the depth of the oversold region. And they are currently around 19.76 and 20.85 levels, indicating that efforts to build a way back into northward advances have increased.
Note: Cryptosignals.org is not a financial advisor. Do your research before investing your funds in any financial asset or presented product or event. We are not responsible for your investing results.
You can purchase Lucky Block here. Buy LBLOCK