Uniswap (UNI/USD) Price Loses Momentum Closely at $7
Estimated Reading Time: 3 minutes
Don’t invest unless you’re prepared to lose all the money you invest. This is a high-risk investment and you are unlikely to be protected if something goes wrong. Take 2 minutes to learn more
Uniswap Price Prediction – January 19
A series of uprisings has surfaced in the UNI/USD market operations to the extent of letting the crypto-economic price lose momentum closely at averaging the $7 resistance point in the process. In the last several hours into today’s transaction activities, the market bargain event has featured between $ 6.1659043 and $5.9878220 at an average minute negative percentage rate of 0.43.
UNI/USD Market
Key Levels:
Resistance levels: $6.50, $7, $7.50
Support levels: $5.50, $5, $4.50
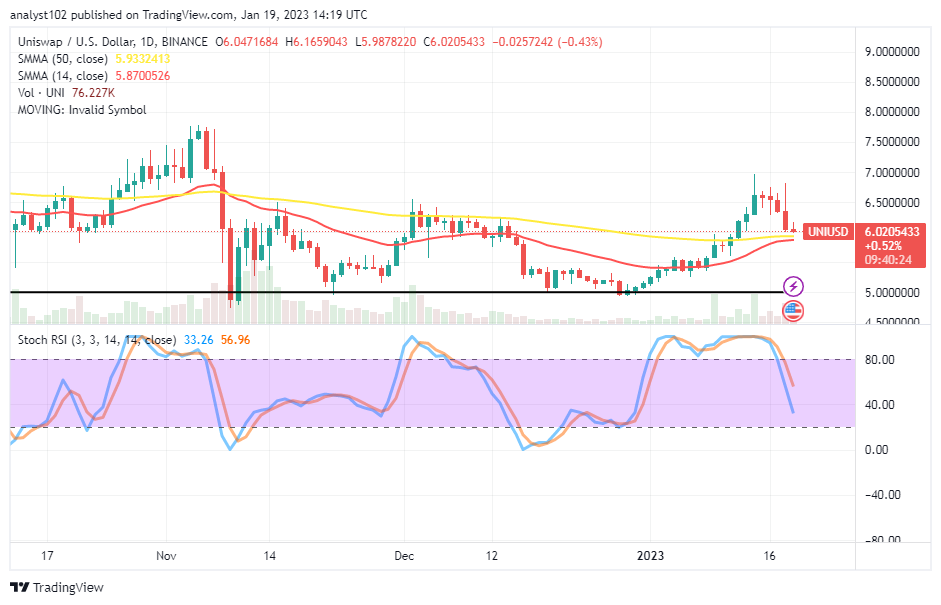
UNI/USD – Daily Chart
The UNI/USD daily chart reveals that the crypto’s price loses momentum closely below the resistance level at $7 during a bullish run outlook on the 14th of this month. On that day, a candlestick eventually ended, producing a top shadow pattern spanning southward after averaging the value line in question. The 14-day SMA indicator is at $5.8700526, nearly underneath the $5.9332413 point of the 50-day SMA indicator. The Stochastic Oscillators have crossed southbound from the overbought region to position at 56.96 and 33.26 levels.
Will the UNI/USD market soon break southward against the SMA trend points?
According to the current technical trading view, the SMA trend lines will be the psychological baseline needed to confirm the continuance of the substantial correction in the UNI/USD trade as its price has lost momentum closely to the $7 resistance. Meanwhile, every indicator points to a negative signal against the trading myth of returning with a long position.
On the reduction-moving side of the technical analysis, bears are to hold their stances in the ongoing retracement cycle against the threshold of the SMA trend lines to act as an upper trading zone before the ower-trading spot where the horizontal line drew at $5 support. Short-position takers looking to join the southward waves between the high and low points suggested should guard against any unexpected upsurges near the $7 barrier.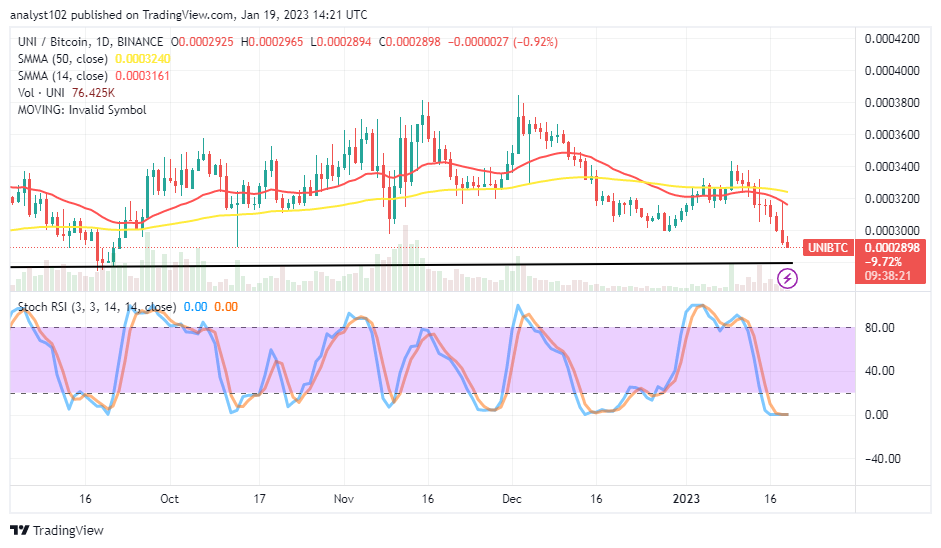
UNI/BTC Price Analysis
In comparison, Uniswap is surrendering to some forces inflicted on it by the trending weight of Bitcoin as the pairing crypto market loses momentum closely to its previous lower-trading support point. The 14-day SMA indicator is underneath the 50-day SMA indicator, crossing southward over the zone where variant bearish candlesticks have continually featured over time. The Stochastic Oscillators are in the oversold region with a short line of consolidating within t. The moves to the downside tend not to end until a bullish candlestick occur afterward.
Note: Cryptosignals.org is not a financial advisor. Do your research before investing your funds in any financial asset or presented product or event. We are not responsible for your investing results.
You can purchase Lucky Block here. Buy LBLOCK