SPONGE/USD: A New Bullish Cycle Awaits as $SPONGE Hovers Just Below $0.00010 Mark
Estimated Reading Time: 3 minutes
Don’t invest unless you’re prepared to lose all the money you invest. This is a high-risk investment and you are unlikely to be protected if something goes wrong. Take 2 minutes to learn more
In the dynamic realm of cryptocurrencies, $SPONGE remains an asset of notable interest. Although recent developments have shown limited change compared to our prior analysis, we stand on the precipice of a potential market upswing. In our previous analysis, we observed two notably robust bullish candlestick patterns, which appear to be laying the foundation for a prospective upward price performance.
Key Levels
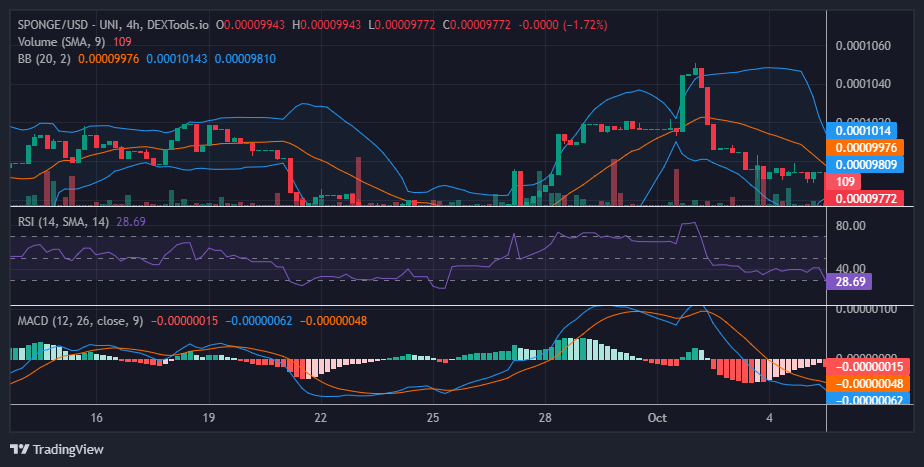
- Resistance: $0.000115, $0.000120, and $0.000125.
- Support: $0.000090, $0.000080, and $0.000085.
Sponge (SPONGE/USD) Price Analysis: The Indicators’ Point of View
Initially, the $SPONGE market embarked on a recovery trajectory from price levels beneath the 20-day moving average. While we anticipate this recovery to persist, the market encountered resistance at a proximate level. Despite the support at $0.0099 remaining intact, the persistent presence of resistance has impeded today’s price recovery. Given the proximity of this resistance level to the crucial support, the bulls find themselves under mounting pressure.
The Relative Strength Index (RSI) continues to indicate a bearish sentiment, with the momentum currently at 40.66. The RSI line exhibits a lateral movement, signifying an ongoing stalemate between the bulls and bears. However, this impasse within the bulls’ territory poses a risk of them ceding further ground. Nevertheless, if the market experiences a more pronounced bearish breakout, it could potentially trigger a noteworthy bullish movement.
$SPONGE Short-Term Outlook: 1-Hour Chart
Viewing the market from this perspective, it becomes evident that it has entered a phase of relative stagnation, hovering at approximately $0.009948. This pattern indicates an impending breakout in a definitive direction. Notably, while the market may seemingly be residing within the bearish region on the 4-hour chart indicator, it is, in fact, in a state of equilibrium. This equilibrium signifies a delicate balance between the demand and supply forces at play.
The data gleaned from the 4-hour chart readings suggests that the position of the bulls within the market is currently experiencing pressure. Nevertheless, it’s worth noting that a downward breakout has the potential to catalyze a substantial price rally.
The Sponge token airdrop is still ongoing for now.
Hey #SPONGERS!!! 📣🧽
Get $SPONGE #Tokens on @CoinWOfficial and join the #Airdrop before it’s over!🚀💰🌊
Don’t miss out! 🧽🌊
🔗 https://t.co/VmLnXCyxue pic.twitter.com/v53H2EHAsX
— $SPONGE (@spongeoneth) October 5, 2023
Invest in the hottest and best meme coin. Buy Sponge ($SPONGE) today!