Polkadot Sways below $5.50 High as It Resumes a Sideways Trend
Estimated Reading Time: 2 minutes
Don’t invest unless you’re prepared to lose all the money you invest. This is a high-risk investment and you are unlikely to be protected if something goes wrong. Take 2 minutes to learn more
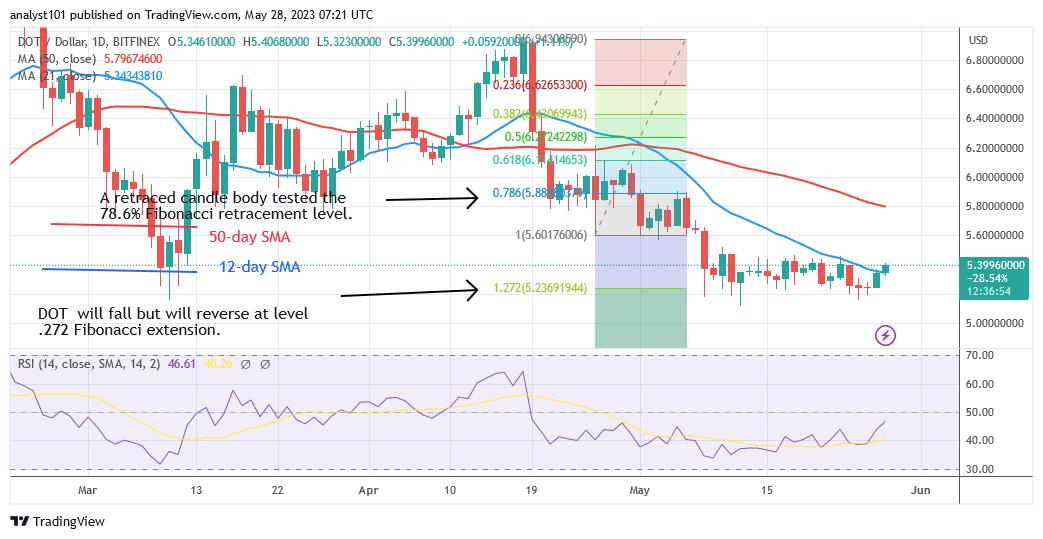
Polkadot (DOT) Long-Term Analysis: Bearish
Polkadot (DOT) price surpasses the 21-day SMA as it resumes a sideways trend. The resistance around $5.50, however, prevented the positive momentum from breaking through. DOT pricing is currently battling to stay below the most recent high. The moment the current resistance is broken, the upward movement will start. If buyers are successful in keeping the price above the moving average lines or the barrier at $6.00, Polkadot will restart its upward trend. DOT is currently caught between the moving average lines. When the moving average lines are crossed, the altcoin will trend. As the market enters the overbought zone, it is unlikely that the coin will climb higher in the meantime.
Polkadot (DOT) Indicator Analysis
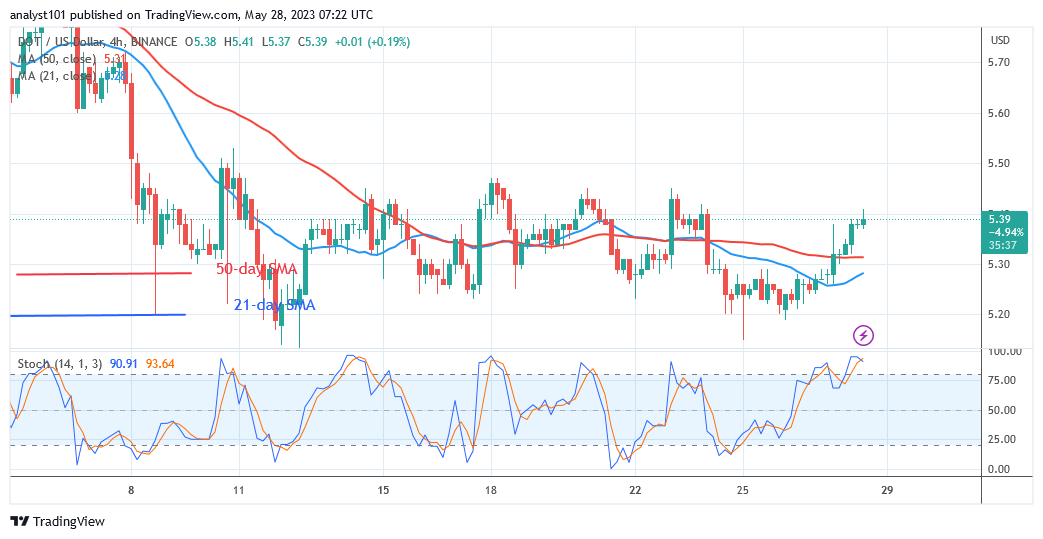
For period 14, Polkadot is at level 49 on the Relative Strength Index. The price of the cryptocurrency asset has reached the equilibrium point, where supply and demand are equal. Additionally, because the price bars are still between the moving average lines, the altcoin will be forced to move in a range. As the market enters the overbought zone, resistance is being encountered by the bullish momentum currently in place. The Daily Stochastic for the alternative coin is below level 80.
Technical indicators:
Major Resistance Levels – $10, $12, $14
Major Support Levels – $8, $6, $4
What Is the Next Direction for Polkadot (DOT)?
Polkadot is swaying below the $5.50 resistance as it resumes a sideways trend. Since May 28, as the altcoin regained bullish momentum, buyers have had a hard time breaking through the recent high. However, if the current resistance holds, the sideways movement may continue.
You can purchase Lucky Block here. Buy LBLOCK
Note: Cryptosignals.org is not a financial advisor. Do your research before investing your funds in any financial asset or presented product or event. We are not responsible for your investing results