Quant Price Prediction: QNT/USD Trades Near $108 Support; Price Prepares for the North
Estimated Reading Time: 3 minutes
Don’t invest unless you’re prepared to lose all the money you invest. This is a high-risk investment and you are unlikely to be protected if something goes wrong. Take 2 minutes to learn more
Quant Price Prediction – April 24
The Quant price prediction reveals that QNT drops to touch the daily low of $108.83 as the price dips for new buyers to surface.
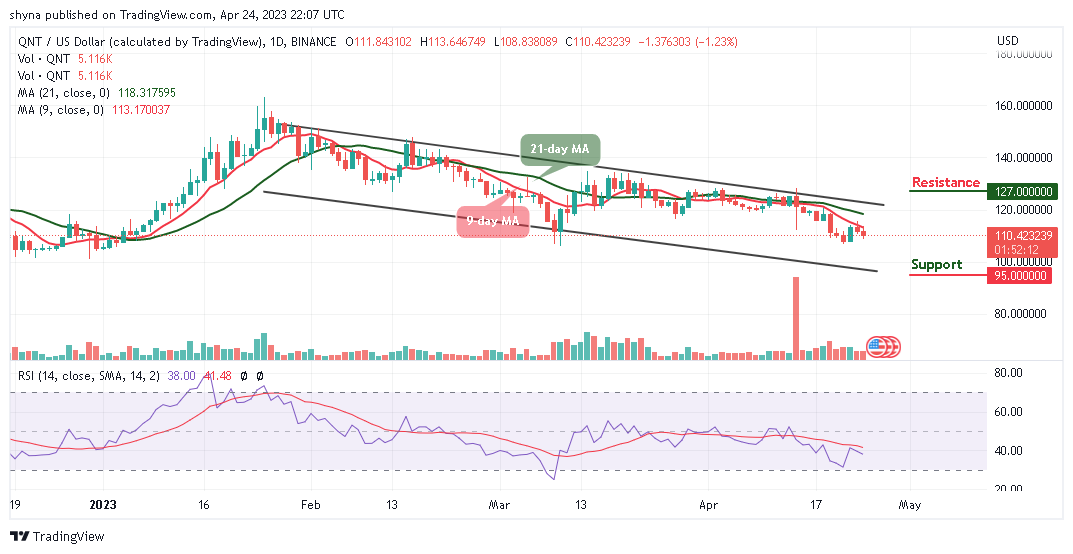
QNT/USD Medium-term Trend: Bearish (1D Chart)
Key Levels:
Resistance levels: $127, $129, $131
Support levels: $95, $93, $91
QNT/USD is trading at $110.42 staying below the 9-day and 21-day moving averages. According to the chart, sellers are bringing the coin towards the south as this could allow the new buyers to step into the market while the existing buyers are expected to buy the dips.
Quant Price Prediction: QNT Price Could Retreat to Move Higher
The Quant price is likely to drop further and it could become cheap for more buyers to come into the market. However, the technical indicator Relative Strength Index (14) reveals that the market will expect move investors to come into the market as the signal line moves below the 40-level. If the price drops more, it could hit the critical supports at $95, $93, and $91.
Moreover, should buyers hold the current support of $110 and push the coin higher; the bulls can expect immediate resistance to be located at $120. Any further bullish movement above the channel’s upper boundary will hit the resistance level of $127, $129, and $131 respectively.
QNT/USD Medium-term Trend: Ranging (4H Chart)
According to the 4-hour chart, the Quant price is moving to cross above the 9-day and 21-day moving averages; this could be the best opportunity for new buyers to enter the market. Similarly, the existing buyers are expected to buy the dip as the market gathers momentum to begin another bullish movement.
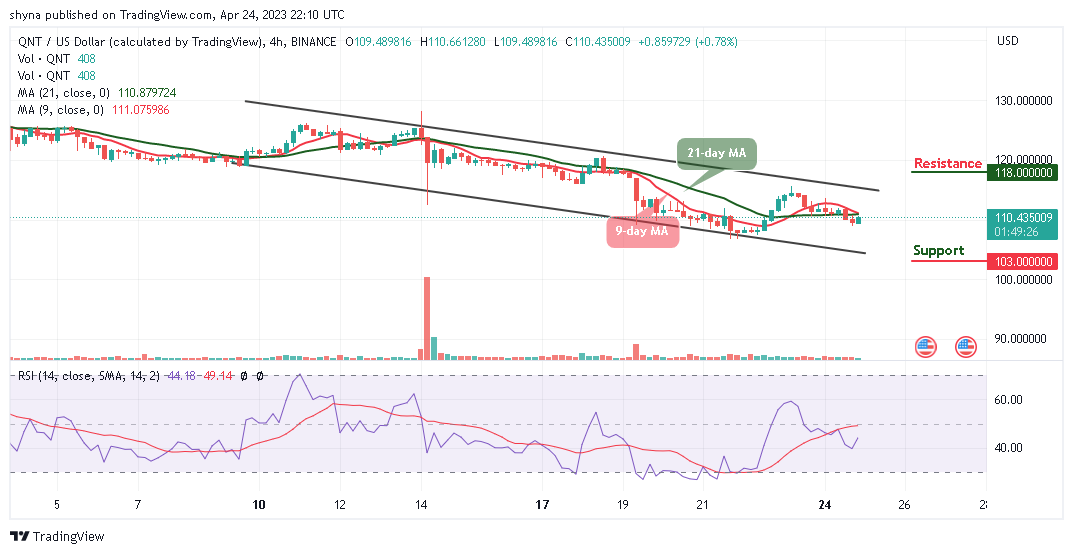
Looking at it from above, if buyers push the price above the moving averages; crossing above the upper boundary of the channel could hit the higher resistance at $118 and above. On the contrary, should the coin retreat and slide below the lower boundary of the channel, support may come at $103 and below while the Relative Strength Index (14) moves to cross above the 50-level, suggesting buying signals are likely to play out.
Place winning Quant trades with us. Get QNT here