Bitcoin (BTC) Price Prediction: BTC/USDT Continues to Shift Toward the $110,000 Mark
Estimated Reading Time: 2 minutes
Don’t invest unless you’re prepared to lose all the money you invest. This is a high-risk investment and you are unlikely to be protected if something goes wrong. Take 2 minutes to learn more

Date: July 9, 2025
Bitcoin has been consolidating above the $108,000 price level in recent sessions. Even the $109,000 mark has been tested multiple times. However, the market has yet to gather enough momentum to break through this resistance level. Let’s examine what could unfold next.
Bitcoin (BTC) Price Prediction: BTC/USDT Long-Term Trend – Bullish (Daily Chart)
Key Price Levels:
Resistance: $110,000, $112,000, $114,000
Support: $108,000, $106,000, $104,000
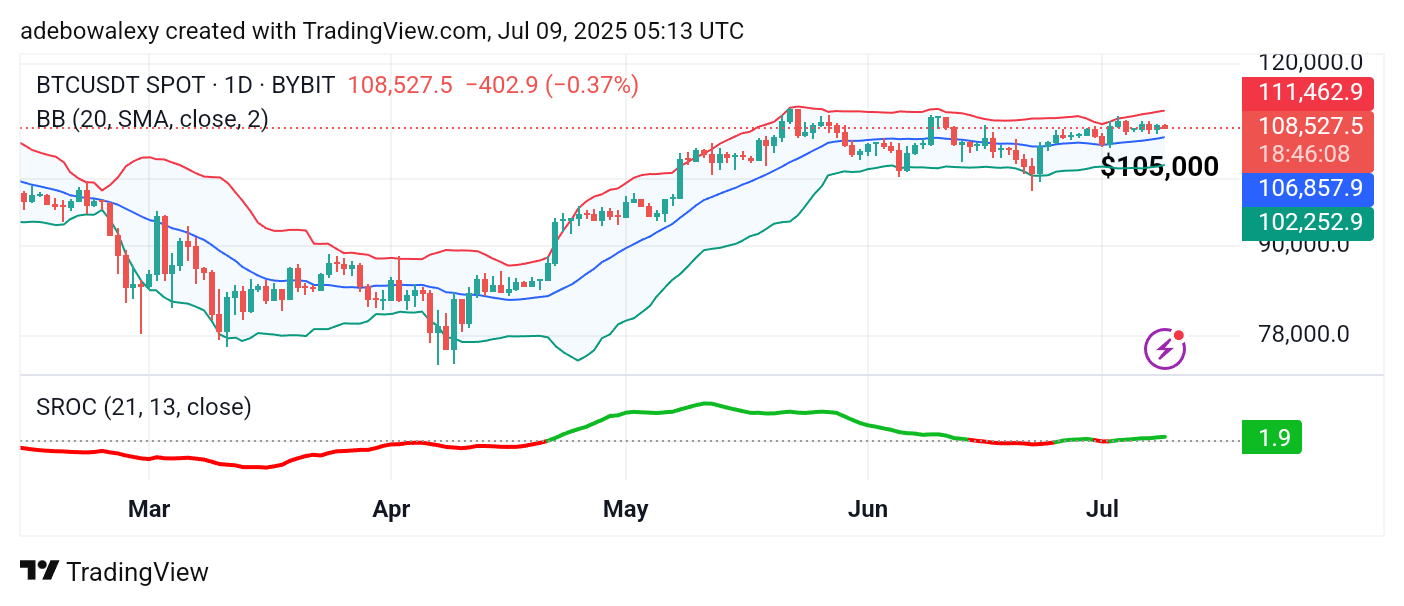
Price action in the Bitcoin market has been consolidating, as mentioned above. Notably, this consolidation is occurring above the middle band of the Bollinger Bands (BB) indicator. Although the most recent price candle is bearish, Bitcoin remains above the \$108,000 threshold. At the same time, the upper band of the BB indicator appears to be trending upward.
The Smoothed Rate of Change (SROC) indicator line also remains above the equilibrium level, tilted slightly upward—suggesting that bullish momentum could be building.
Bitcoin (BTC) Price Prediction: BTC/USDT Still Leans Toward Higher Grounds
Bitcoin continues to trade near elevated price levels. On the daily chart, recent price activity has been marked by a series of small candles over the last four sessions, moving in a relatively narrow and vertical range.
Despite the consolidation, the position of price action suggests that bullish momentum could strengthen. Likewise, the SROC indicator supports this outlook, with its lines pointing to a possible continuation of the uptrend.
Bitcoin (BTC) Price Prediction: BTC/USDT Hugs Key Levels (4-Hour Chart)
On the 4-hour chart, Bitcoin’s price has dipped slightly below the midline of the BB indicator. The current price candle is green but remains just under the middle band, still making contact with it.
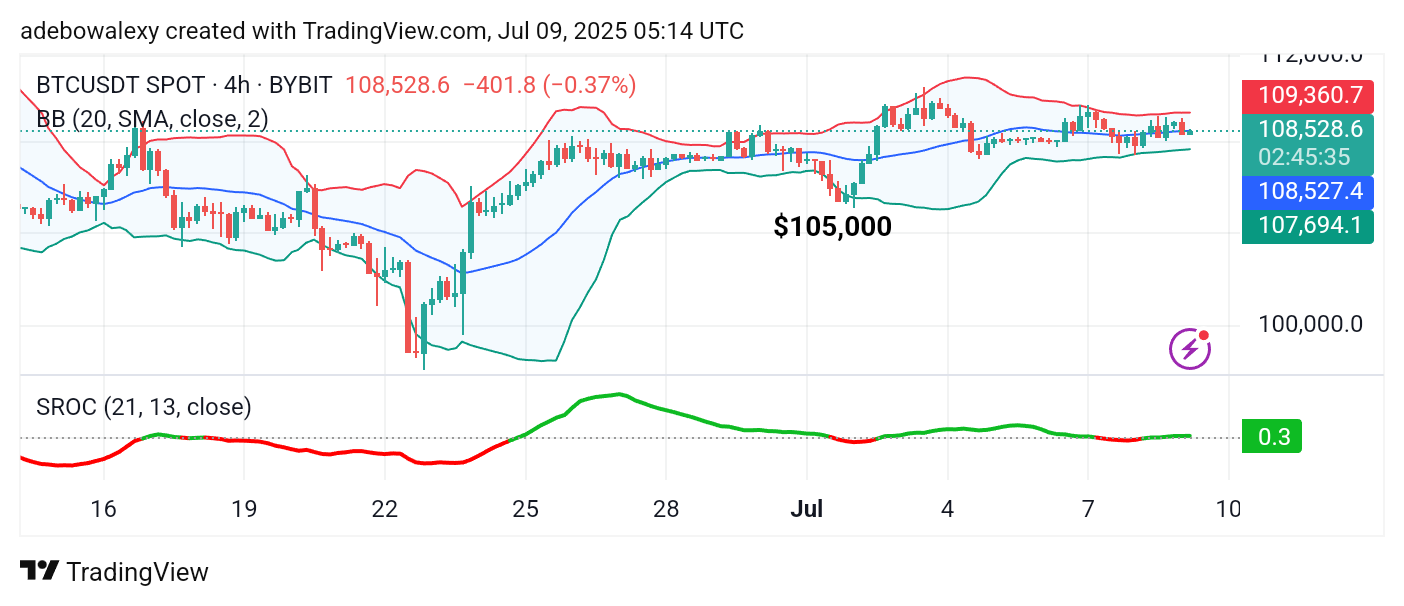
Similarly, the SROC indicator line is green and positioned just above the equilibrium level. Given that the current candle is bullish and the SROC indicator shows a positive trend, there is a strong indication that Bitcoin may soon attempt to breach the $110,000 resistance level.