Litecoin (LTC) Price Prediction: LTC/USDT Isn’t Seeing Much Gain
Estimated Reading Time: 3 minutes
Don’t invest unless you’re prepared to lose all the money you invest. This is a high-risk investment and you are unlikely to be protected if something goes wrong. Take 2 minutes to learn more

Date: July 8, 2025
As of the time of writing, the Litecoin market isn’t making significant upward progress. Although its price action sits on a promising support level, the market is not yet in the green. Consequently, it seems this market awaits a fresh catalyst.
Litecoin Price Prediction: LTC/USDT Long-Term Trend – Bullish (Daily Chart)
Key Price Levels:
Resistance: $90, $95, $100
Support: $80, $75, $70
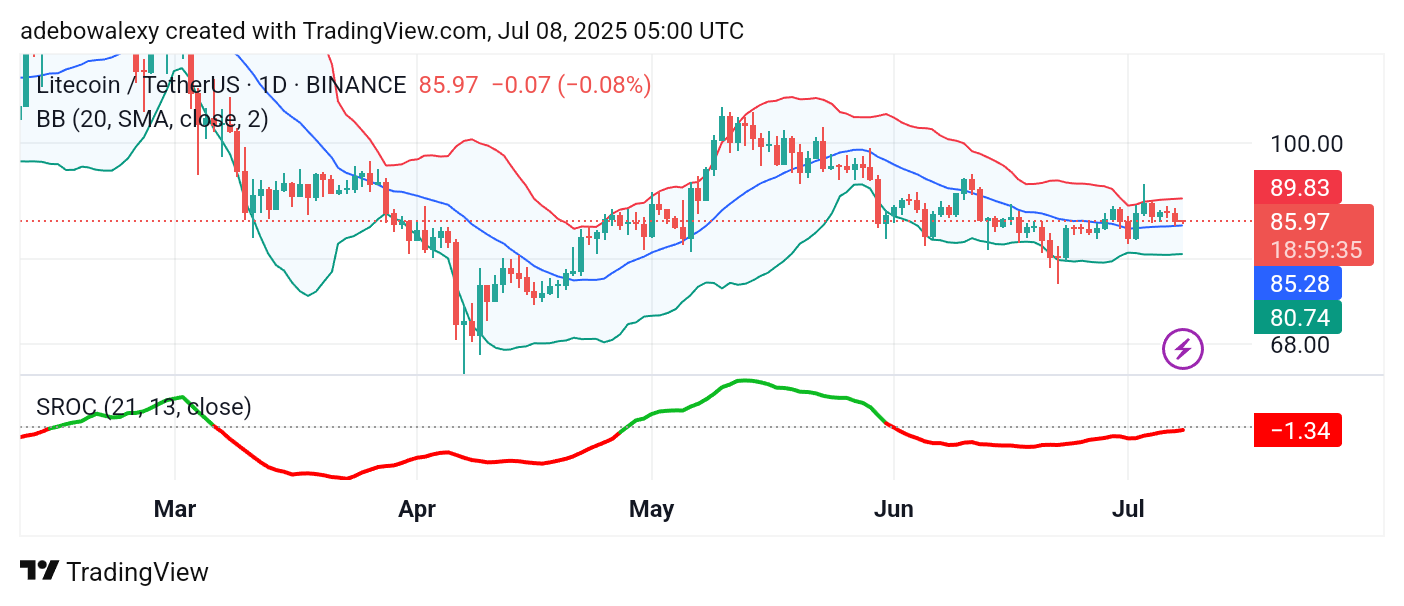
The Litecoin market has seen a modest downward retracement over the past three sessions. Consequently, the token is now trading just above the middle band of the Bollinger Bands (BB) indicator. Although the last price candle is red, it has a notably small body, suggesting weakening bearish momentum. Meanwhile, the Smoothed Rate of Change (SROC) indicator line continues to rise steadily toward the equilibrium level from below. Notably, the line of this indicator remains green, reinforcing the bullish potential.
Litecoin (LTC) Price Prediction: LTC/USDT Outlook
The Litecoin daily chart has shown modest losses in recent sessions. Nevertheless, the token’s price action remains above a favorable support level. The most recent red candle is relatively small, which suggests that downward pressure may be diminishing.
Given that the price stands just above the middle band of the BB indicator, this hints at a possible rebound to the upside. Meanwhile, the SROC indicator line is still below the equilibrium level but maintains an upward trajectory. Technically, this suggests that bullish momentum may soon resume, pushing prices higher.
Litecoin (LTC): LTC/USDT Consolidates at Support (4-Hour Chart)
The Litecoin 4-hour chart reveals that price action may be well-positioned for a rebound near the middle band of the BB indicator. However, on shorter time frames, price action appears to be consolidating around the lower band of the BB indicator.
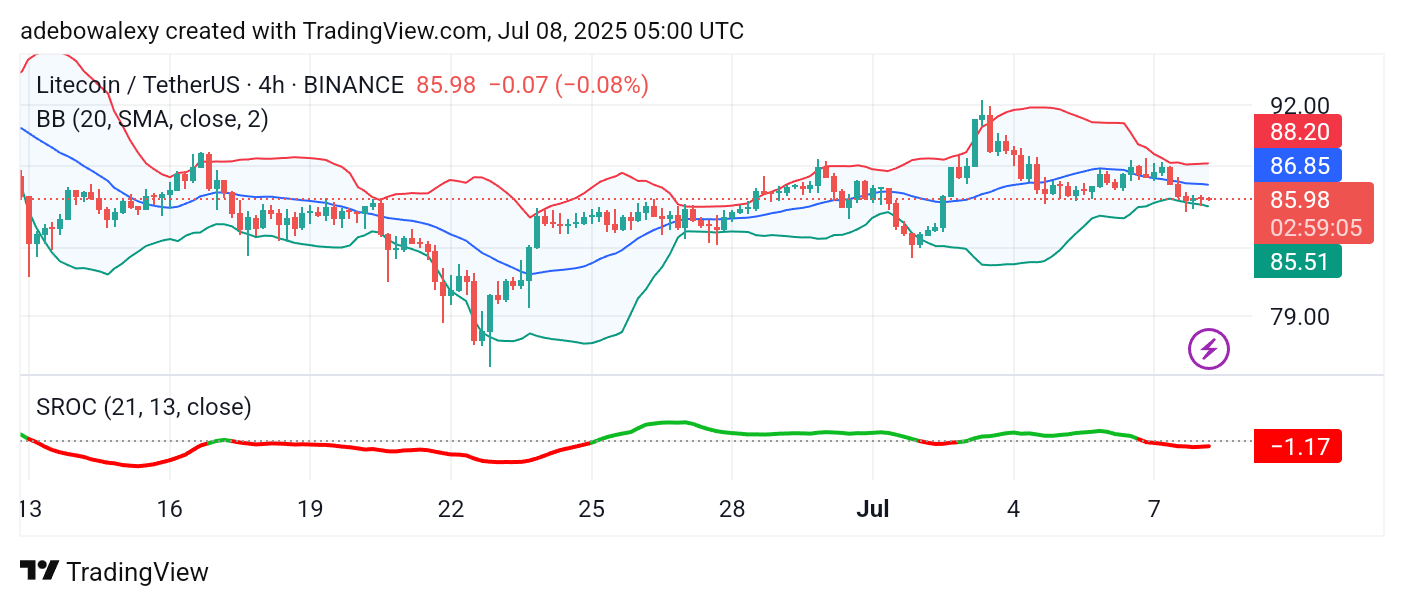
At the same time, the SROC line is beginning to flatten out after a previous downward trajectory. Therefore, the market may be gearing up for a directional move. This outlook is supported by the fact that price action is currently at a technical limit and may soon rebound toward the $90 mark for short-term gains.