Bitcoin (BTC/USD) Trade Reverts to a Correction, Hitting $52,500
Estimated Reading Time: 4 minutes
Don’t invest unless you’re prepared to lose all the money you invest. This is a high-risk investment and you are unlikely to be protected if something goes wrong. Take 2 minutes to learn more
Bitcoin Price Prediction – February 21
A long straight line has been produced in the market operations of Bitcoin against the valuation of the US coin as the crypto-economic trade reverts to a correction after hitting a resistance around the point of $52,500.
For the lengthy upward-trending price movements to pause, it would be imperative that they collapse around the reasonable resistance level above $50,000. Given the current state of the crypto economy signal, the candlestick formation pattern indicates that it will take some time for bulls to regain momentum. The best entrances to regain longing entries will come from the stochastic oscillators shifting their posture into smaller zones and pointing back upward with a bullish candlestick in the process afterward.
BTC/USD Market
Key Levels:
Resistance levels: $52,500, $55,000, $57,500
Support levels: $47,500, $45,000, $42,500
BTC/USD – Daily Chart
The BTC/USD daily chart reveals that the crypto-economic trade reverts to a correction, hitting a resistance value of $52,500.
The Bollinger Band trend lines have stretched strongly to the north side at the upper side to create a shield above the point of $52,500. A line of rejection signs has been featured around the value to indicate that downward shifts are imminent. The stochastic oscillators have been placed southerly across the point of 80.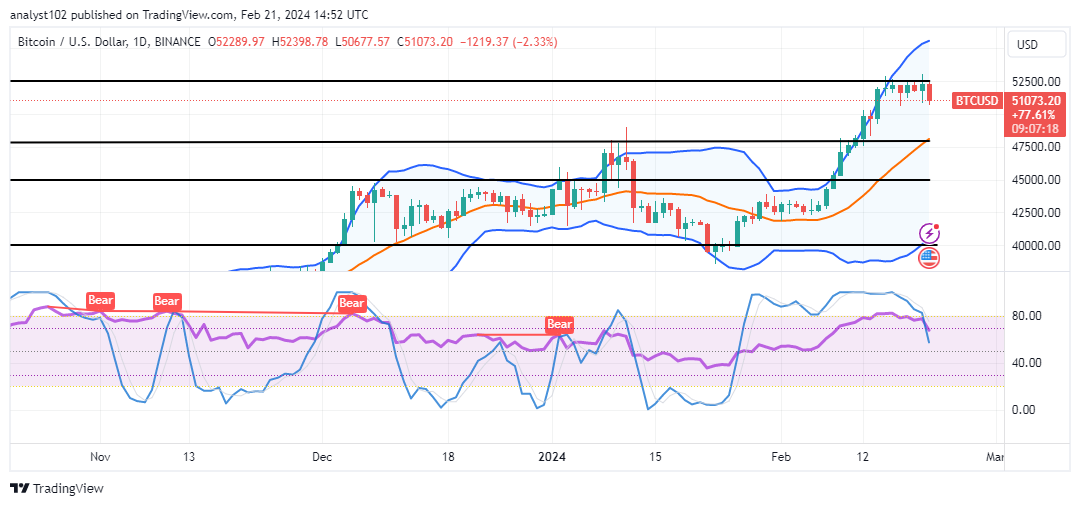
What might occur if the price of bitcoin/USD reverses soon against the $52,500 mark?
A reversion signal of the present condition in the BTC/USD market will probably make the buying pressure rally stably through some higher resistances, as it is recorded that the market has reverted to a correction mode, hitting a resistance value of $52,500 recently.
Given the emergence of a noteworthy bearish candlestick, those that push long positions must halt their efforts to execute long orders immediately. In order to uncover good purchasing opportunities, buyers should hold off until they see another perfect price pattern, which may occur around the values of $47,500 and $45,000 if the retracement becomes severe.
As of right now, the market is displaying signs of a bearish resurgence, with the operation indicating that a significant decrease is still underway below the $52,500 threshold. It is anticipated that sellers will execute a shorting order in the vicinity of the value line. They must exercise caution in not exaggerating their positions in opposition to the point.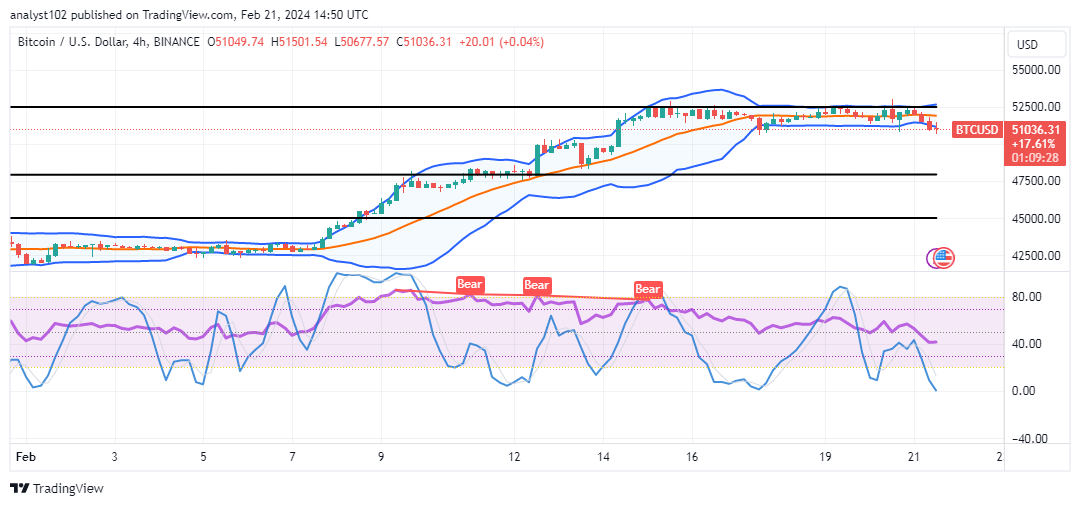
BTC/USD 4-hour Chart
The BTC/USD 4-hour chart shows that the crypto economy has attempted to revert to a correction, hitting a resistance of $52,500.
The upper Bollinger Band trend line has produced a sequence of higher lows as it has moved easterly. In order to confirm that a rejection must occur, the other Bollinger Band indicators are also shown to be closely highlighted in the upper parts. Once again, the stochastic oscillators are in the oversold area; stretching through the lower Bollinger Band’s path will result in more declines if the placement appears to be acquiring postures in a consolidation-like manner.
Note: Cryptosignals.org is not a financial advisor. Do your research before investing your funds in any financial asset or presented product or event. We are not responsible for your investing results.
You can purchase Lucky Block here. Buy LBLOCK