Bitcoin (BTC/USD) Trade Is Converging, Making a Baseline
Estimated Reading Time: 3 minutes
Don’t invest unless you’re prepared to lose all the money you invest. This is a high-risk investment and you are unlikely to be protected if something goes wrong. Take 2 minutes to learn more
Bitcoin Price Prediction – January 17
In the recent trade sessions, a line of price actions has pushed in corrections after bulls lacked the capability to surge more sustainably past the resistance line of $47,500, meaning that the BTC/USD trade is currently converging at a lower spot above the point of $40,000, making a baseline.
Price action reversions have been combining a series of dips with rising moves to create opportunities for bulls to cover their opening positions above $40,000. It now appears that the value line is the critical support level to prevent the price from smoothly moving southward.
BTC/USD Market
Key Levels:
Resistance levels: $47,500, $50,000, $52,500
Support levels: $40,000, $37,500, $35,000
BTC/USD – Daily Chart
The BTC/USD daily chart showcases that the crypto-economic price is converging trade waves below the middle Bollinger Band, making a baseline.
The Bollinger Bands at the lower part have been demonstrating that the point of $40,000 is going to be tough for efforts to create a situation for further free fall-offs beyond the value point. The stochastic oscillators have dipped into the oversold region to exhibit that buyers are to fasten their belts against getting buy-in orders while the market shows a sign of recovery from a decline.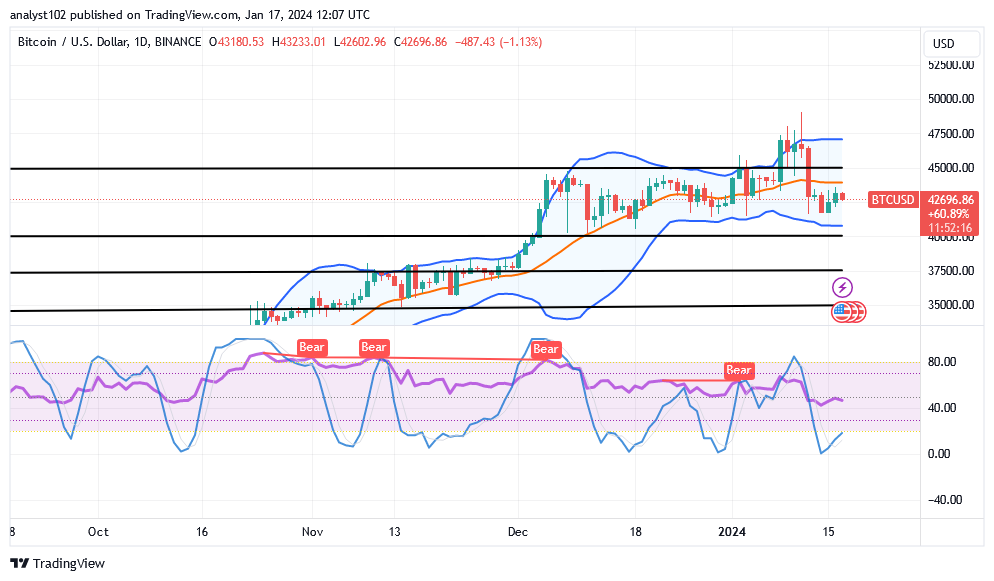
What barrier trade line currently stands against the BTC/USD market as it trades around $42,696.86?
The basic bargaining line that has to be fearfully breached to the upside has been seen to be around the value line of $45,000, as the BTC/USD market is converging below the middle Bollinger Band, making a baseline.
The Bollinger Band trend lines are still generally systemically positioned to indicate that the primary resistance line is around $47,500 and the crucial support trade is at $40,000, where buyers should be wary of potential reversals. Long-position takers are encouraged to employ a shorter time frame chart, such as a 1-hour type, to monitor a decent and timely entrance.
Bears will need to use extreme caution as of the writing of this technical report to avoid any active movement that could result in losses as they pursue further lows towards $40,000.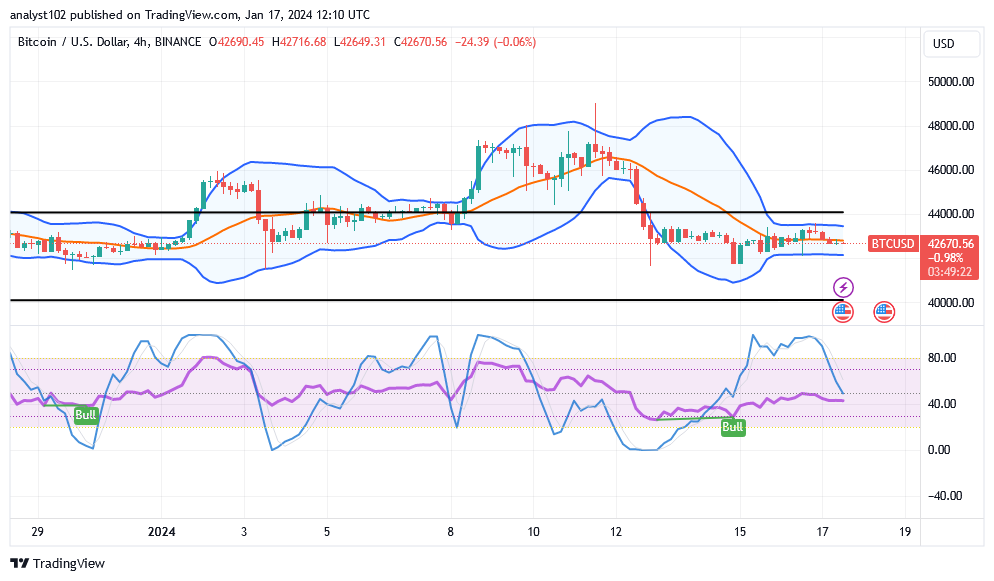
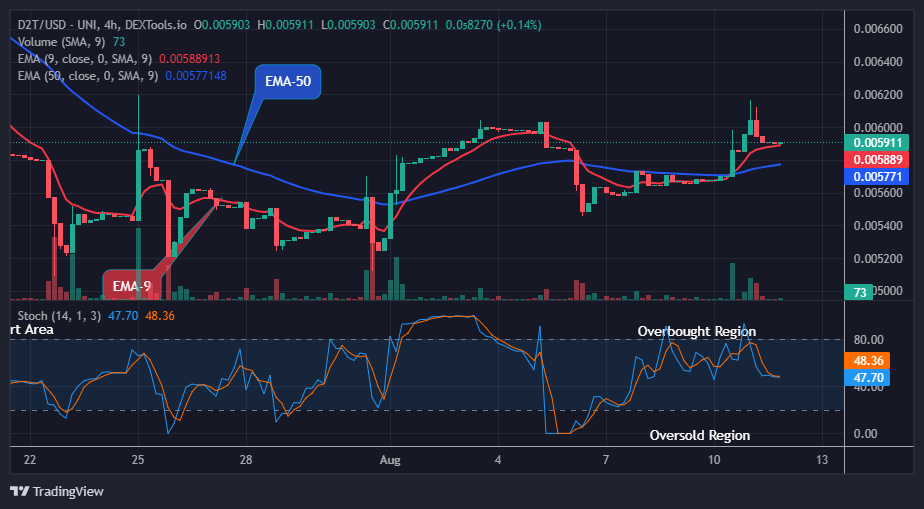
BTC/USD 4-hour Chart
The BTC/USD 4-hour chart shows the crypto trade is converging in the Bollinger Bands, making a baseline around the lower side.
The Bollinger Band trend lines are able to align themselves between the $4,000 and $42,000 values in a southerly direction. At the 40-point, the stochastic oscillators crossed over to the south, suggesting that a line of lows is speculatively moving southward to let the price regain positions that may lead back to construct an uprising motion path.
Note: Cryptosignals.org is not a financial advisor. Do your research before investing your funds in any financial asset or presented product or event. We are not responsible for your investing results.
You can purchase Lucky Block here. Buy LBLOCK