Bitcoin (BTC/USD) Trade Is Correcting, Hitting a $47,500 Resistance
Estimated Reading Time: 4 minutes
Don’t invest unless you’re prepared to lose all the money you invest. This is a high-risk investment and you are unlikely to be protected if something goes wrong. Take 2 minutes to learn more
Bitcoin Price Prediction – January 10
Following the rate of uprising velocity that seems to be carrying some weighty leftover forces, bulls in the market activities of Bitcoin versus the valuation of the US coin have managed to surge higher to hit a $47,500 resistance, and it is currently correcting at the $45,755.91 spot.
In order to establish a new base point and acquire a decent purchasing entry order at a discounted value, it is important to consider the valuation of the cryptocurrency economy trade at a lower spot indicated by variant indicators at complementing states. While that sentiment is satisfied, buyers should be alerted as to when to observe price action to execute an order. In order to support a re-buying order with active price movement, it is technically optimal for the oscillators to get re-positioned by pointing back northward at a specific point.
BTC/USD Market
Key Levels:
Resistance levels: $47,500, $50,000, $52,500
Support levels: $42,500, $40,000, $37,500
BTC/USD – Daily Chart
The BTC/USD daily chart reveals that the crypto-economic trade is correcting after hitting a $47,500 resistance level.
The Bollinger Band indicators remain positioned northwardly, shielding trade points closely underneath the line of $47,500 on the higher side and a point closely beneath the value line of $42,500. The stochastic oscillators have been placed higher around the line of 80. And the current trending force shows that the emergence of candlesticks has been bearishly seen in the last two days.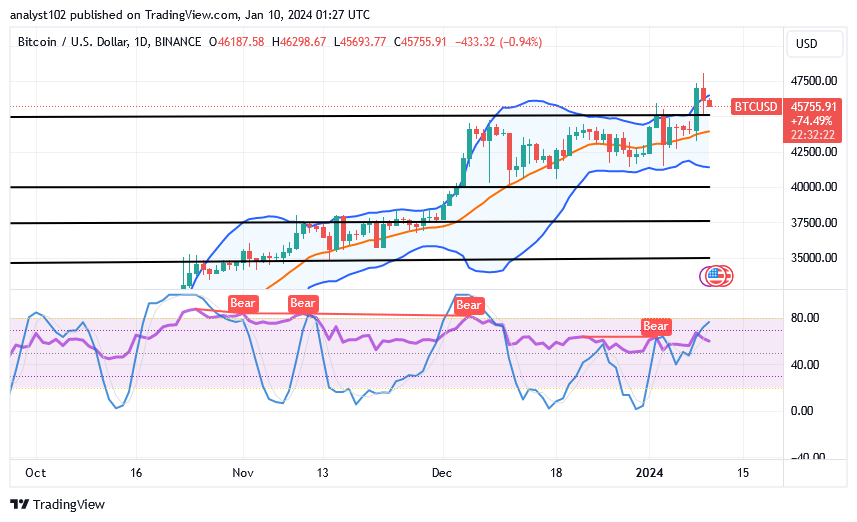
Is it currently technically advantageous for purchasers to begin buying back Bitcoin again as the price of the coin hovers around $5,755.91?
The last two days of declining pressure have to be enough of a confirmatory signal for sellers to be taking positions above the Bollinger Bands, given that the BTC/USD market is correcting, hitting a $47,500 resistance line in the last increase motion cycle.
Before triggering a shorting order, bears needed to be aware of how price moves in the market would respond around the upper Bollinger Band trend line. A middle Bollinger Band touch that is pointing downward and has the tendency to give way to a long-term halt might quickly lose its position and turn risky, which could eventually make room for longing moves.
As things stand, the Bollinger Bands continue to be positioned higher, creating psychologically lower, reasonable trade zones where long-position takers can locate their re-entry into the market if downward moves continue to intensify in accordance with their current observable impact. However, investors are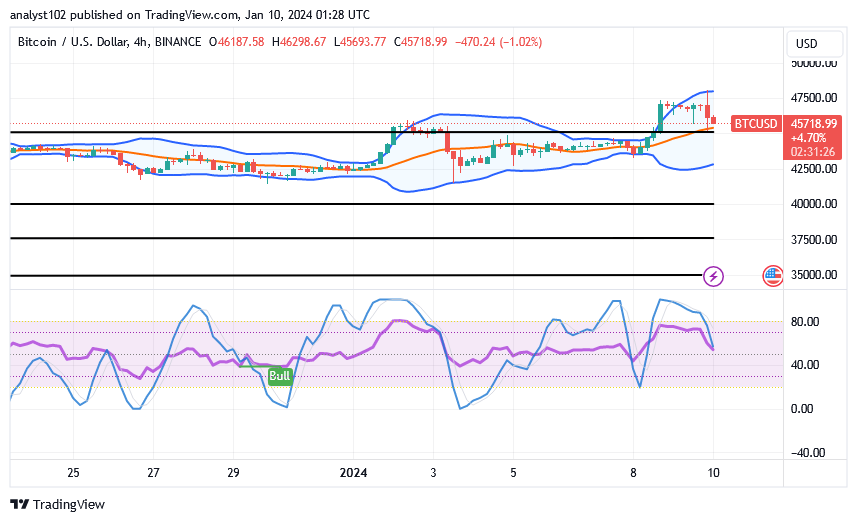
BTC/USD 4-hour Chart
The BTC/USD 4-hour chart shows the crypto market is correcting, hitting a $47,500 resistance line around the upper Bollinger Band.
Right now, the stochastic oscillators are crossing southward, putting them south of the 40th point. The Bollinger Band trend lines have been distinctively placed to maintain transaction spots of $47,500 and $42,500. According to this article, it appears risky to place a shorting order around the middle Bollinger Band in an attempt to heed its dropping force indication. Rather, traders might decide to hold off on making a move until a bullish candlestick appears to anticipate a near-term resurgence of the purchasing frenzy.
Note: Cryptosignals.org is not a financial advisor. Do your research before investing your funds in any financial asset or presented product or event. We are not responsible for your investing results.
You can purchase Lucky Block here. Buy LBLOCK