Bitcoin (BTC/USD) Price Is in Range Bounds, Holding a Correction
Estimated Reading Time: 3 minutes
Don’t invest unless you’re prepared to lose all the money you invest. This is a high-risk investment and you are unlikely to be protected if something goes wrong. Take 2 minutes to learn more

Bitcoin Price Prediction – December 27
Price actions that have been marking ups and downs in the deals between Bitcoin and the valuation of the US currency, given that the crypto-economic trade is in range bounds, are holding a correction.
Both long and short position placers must be extremely cautious and patient when carrying out positional directives. The range-bound zones have been maintained at higher points where the forces of rebellion are likely to continue, particularly if the $40,000 support level is not breached during the current correctional motion. Once the stochastic oscillators confirm the oversold state to the greatest extent possible, bulls are likely to recover.
BTC/USD Market
Key Levels:
Resistance levels: $45,000, $47,500, $50,000
Support levels: $40,000, $37,500, $35,000
BTC/USD – Daily Chart
The BTC/USD daily chart reveals the crypto-economic market is in range bounds, holding a correction session toward the point of 440,000.
The stochastic oscillators have stayed positioned southerly, approaching the line of 20. And they are still relatively pointing to the south to denote that some leftover declining gravity is in place. The Bollinger Band trend lines are placed around the major points between $45,000 and $40,000.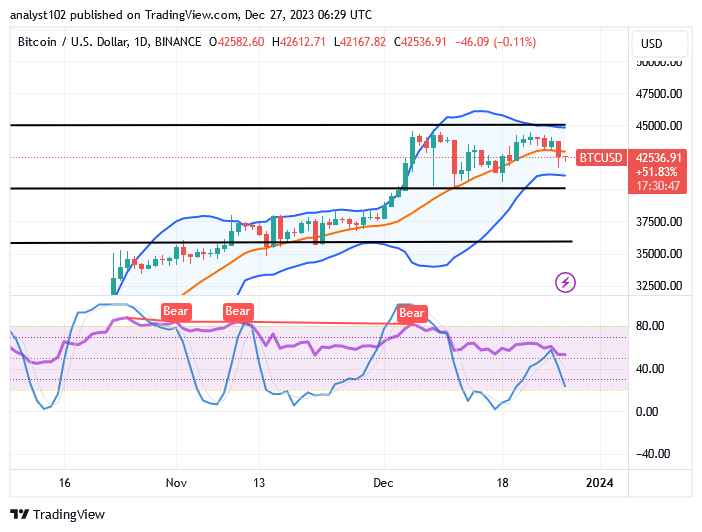
Given that the BTC/USD market is currently trading at $42,523.61, are there any indications that bears may take the offensive against $40,000?
It is not ideally okay to follow any force further down toward the support of $40,000, as the BTC/USD market is in range bounds, holding a correction.
For more detailed explanations of the increasing technical analysis, investors should enter the market when the price regains a bouncing signal from about the $40,000 main support point, or the situation may turn around the lower Bollinger Band point in good time.
At this stage of the market, it is often risky to get a good shorting entry as the price is generally moving lower and closer to the lower Bollinger Band. For sellers, it would be wise to hold off on clicking the sell button until after they receive a significant number of rejections at a prominent peak trading zone.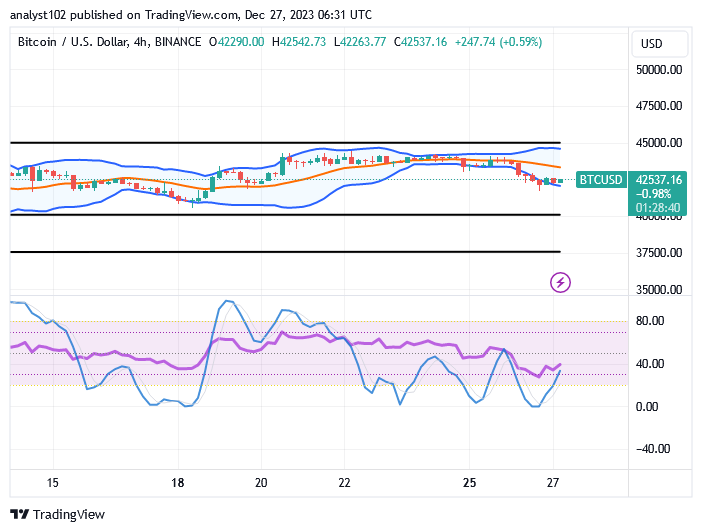
BTC/USD 4-hour Chart
The BTC/USD 4-hour chart showcases that the crypto-economic price is in range bounds, holding a correction around the lower Bollinger Band.
The trend lines of the Bollinger Band are oriented eastward to confirm the presence of a sideways chain. In lower quantity lengths, the majority of the forces have shifted in the opposite direction of the upward motion. The stochastic oscillators have made an effort to move back toward the north. And they are indicating 40 to the north. As of the time of this psychological write-up, it indicates that bulls have been regaining pace on a moderate system, as the analysis is based on hourly data.
Note: Cryptosignals.org is not a financial advisor. Do your research before investing your funds in any financial asset or presented product or event. We are not responsible for your investing results.
You can purchase Lucky Block here. Buy LBLOCK