Quant Price Prediction: QNT/USD Prepares for a Strong Upside Price Rally
Estimated Reading Time: 2 minutes
Don’t invest unless you’re prepared to lose all the money you invest. This is a high-risk investment and you are unlikely to be protected if something goes wrong. Take 2 minutes to learn more
Quant Price Prediction – May 6
The Quant price prediction will recover to the upside as the coin gets ready for a cross above the 9-day and 21-day moving averages.
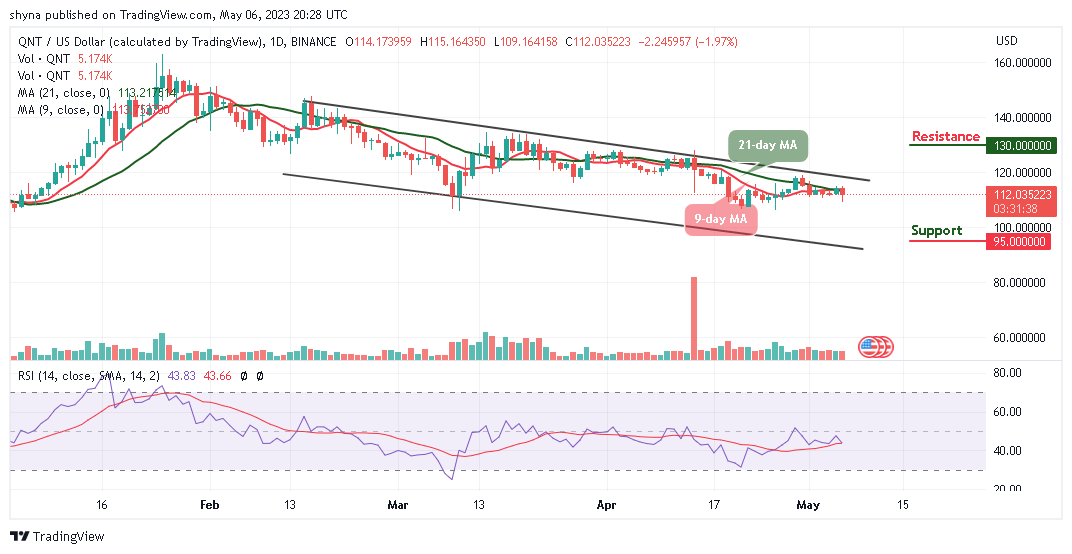
QNT/USD Medium-term Trend: Ranging (1D Chart)
Key Levels:
Resistance levels: $130, $135, $140
Support levels: $95, $90, $85
QNT/USD ranges as the coin gets ready to cross above the 9-day and the 21-day moving averages. Meanwhile, the market will become cheaper so that new and existing buyers can enter. However, should the bulls fail to push the price upward, the Quant price may continue with the sideways movement before heading to the upside.
Quant Price Prediction: QNT/USD Would Move Higher
The Quant price will break toward the upper boundary of the channel if the bulls make the coin hit the $120 level. However, any further bullish movement above the upper boundary of the channel will hit the potential resistance levels of $130, $135, and $140.
On the contrary, the upward movement may be delayed if the coin heads toward the lower boundary of the channel which could touch the low of $95, $90, and $85 support levels. Moreover, the technical indicator Relative Strength Index (14) remains above the 40-level to prepare for the upward movement.
QNT/USD Medium-term Trend: Ranging (4H Chart)
According to the 4-hour chart, the Quant price is moving to cross above the 9-day and 21-day moving averages. In addition, if the buyers push the price toward the upper boundary of the channel, higher resistance could be located at $118 and above.
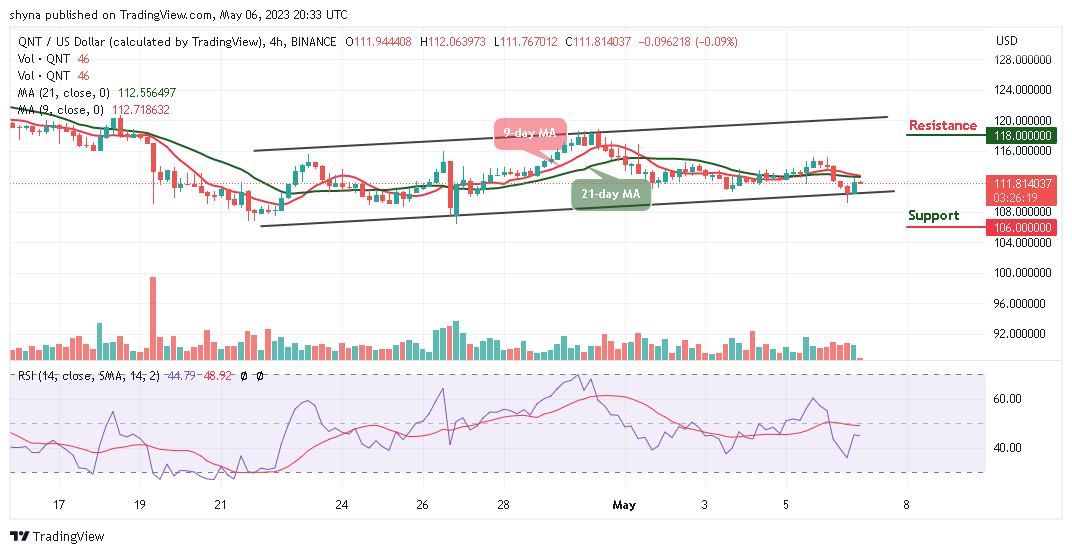
Moreover, the technical indicator Relative Strength Index (14) moves above the 40-level, encouraging new and existing buyers to invest in the coin. Therefore, should the bulls fail to move the current market value above, bears may step back into the market, and the nearest support level could be found at $106 and below.
Place winning Quant trades with us. Get QNT here