Bitcoin (BTC/USD) Price Is Rebounding, Following a Base at $29,000
Estimated Reading Time: 3 minutes
Don’t invest unless you’re prepared to lose all the money you invest. This is a high-risk investment and you are unlikely to be protected if something goes wrong. Take 2 minutes to learn more
Bitcoin Price Prediction – August 2
In the last technical analysis write-up, it was projected that the BTC/USD market would garner catalysts around the $30,000 line, but the crypto’s price eventually began rebounding after finding a base at $29,000.
As of right now, growing pressure is expected to try to re-enter its prior upper range-bound areas between $30,000 and $32,000, according to the technical trading signals. Due to the early hour of today’s session when this piece was put together, the price is projected to be around a minute positive percentage rate of 0.37 to demonstrate how the market forces are traded between $29,767.87 and $30,122.84.
BTC/USD Market
Key Levels:
Resistance levels: $32,000, $33,000, $34,000
Support levels: $29,000, $28,000, $27,000
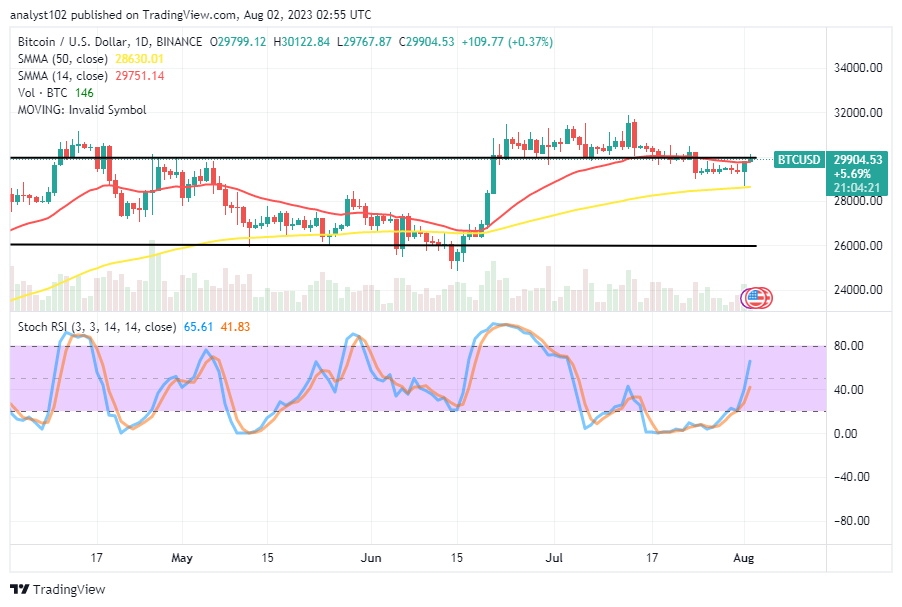
BTC/USD – Daily Chart
The BTC/USD daily chart depicts the crypto’s price rebounding, following a base at $29,000, while it could achieve that in about a few days.
Above the 50-day SMA sign, the 14-day SMA indicator shows a modest southerly bend. They also have points between $29,751.14 and $28,630.01 in possession. The stochastic oscillators, which are situated between 41.83 and 65.61 points, have successfully changed their direction from a southward crossing to a northward kind.
What is the crucial point that shouldn’t be sustained as the BTC/USD trade is on the rise?
Long-position movers in the Bitcoin market operation against the US Dollar have to continue with the pushes to ensure that bears do not suddenly grab control as the cryptocurrency is rebounding steadily after it found a base at the $29,000 support zone during yesterday’s exchanges.
In the long run, bulls are expected to reposition and dwell in the following days within their former range-bound axis of $30,000 and $32,000 ahead of further northward breakthroughs afterward.
Sellers may allow the price to rise over the lower range point of $30,000 and place a shorting order while an active reversal is seen along the line that may have been running with rejections for at least three to four hours. This is in contrast to the upward technical analysis discussed above. To see if such sentiment will manifest a better sense of decency, the trade resistance of about $32,000 might still be anticipated. 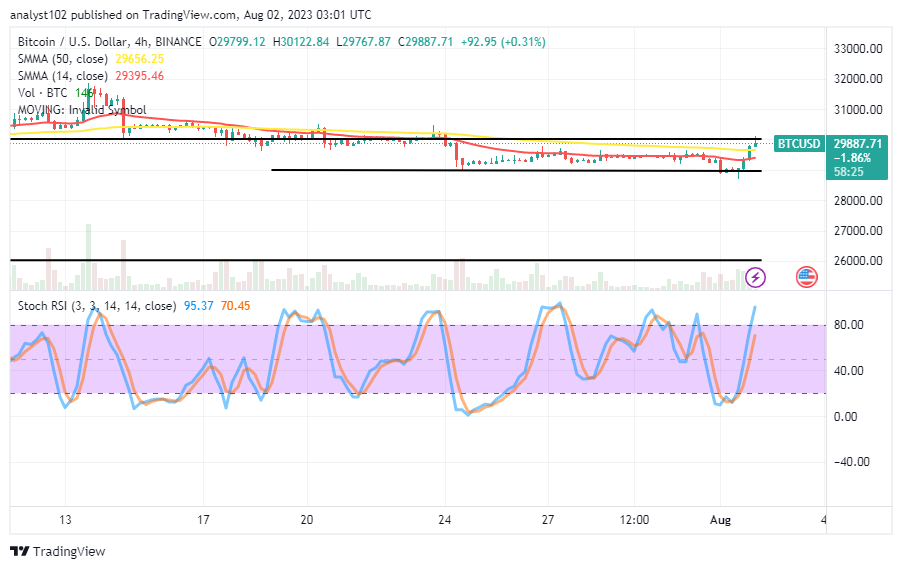
BTC/USD 4-hour Chart
The BTC/USD 4-hour chart showcases that the crypto-economic price is rebounding, following a base at the $29,000 support point.
Prior to the bulls regaining the strength to rush back upward and push through the SMAs’ points, there was a momentary breakdown of the $29,000 level that was noted. The 14-day Moving Average is currently $29,395.46 less than the 50-day Moving Average, which is at $29,656.25. The Stochastic Oscillators have moved in a northward direction, showing that the important gravitational shifts to the north have reached peaks between 70.45 and 95.37.
Note: Cryptosignals.org is not a financial advisor. Do your research before investing your funds in any financial asset or presented product or event. We are not responsible for your investing results.
You can purchase Lucky Block here. Buy LBLOCK