Bitcoin (BTC/USD) Trade Is Holding a Base at $30,000, Garnering a Catalyst
Estimated Reading Time: 3 minutes
Don’t invest unless you’re prepared to lose all the money you invest. This is a high-risk investment and you are unlikely to be protected if something goes wrong. Take 2 minutes to learn more
Bitcoin Price Prediction – July 20
The trade forces marking ups and downs in the BTC/USD market operations have metamorphosed into a situation demonstrating that the crypto-economic trade is holding a base at $30,000, garnering a catalyst from the technical point of view at the time of this piece.
According to the market’s current momentum, there has been a modest active reversal trend in the movement, causing the price to trade at roughly $30,318.71 between the value lines of $30,524.15 and $29,978.30 with a positive 1.03%. Although buyers have been attempting to prevent additional southward movement against the $29,000 support line, the main movements are subject to several cautions.
BTC/USD Market
Key Levels:
Resistance levels: $32,000, $33,000, $34,000
Support levels: $29,000, $28,000, $27,000
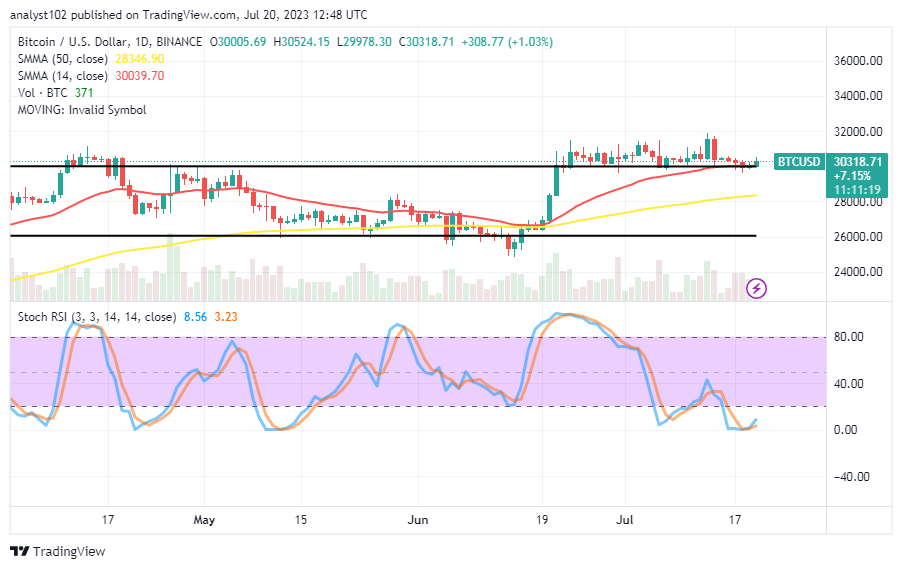
BTC/USD – Daily Chart
The BTC/USD daily chart showcases that the crypto market has been holding a base at $30,000, garnering a catalyst around the trade arena of the smaller indicator.
The 14-day SMA indicator is $30,039.70 above the $28,346.90 of the 50-day SMA indicator. A series of candlesticks have been emerging, basically around the points of $30,000 and $32,000. The Stochastic Oscillators have penetrated the oversold region. And they have briefly positioned themselves northbound from 3.23 to 8.56 levels.
Which direction is the price of the BTC/USD market currently most likely to take in the near future?
A re-occurrence of stoppages to declines has been featured over time around a little higher-trade support zone of $29,000, as we have seen that the crypto-economic trade is holding a base at $30,000, garnering a catalyst.
Long-position trading activities may have to allow some pushes in the southward direction away from the $30,000 during the time of volatility to find a foothold toward or around the support spot of the $28,000 in the long-term run before swinging back to the upside.
Short-position takers may need to think about actively reversing an upward advance while looking for early warning signs over shorter time periods, like 15 minutes or an hour. The major lower range location at the upper trading spots needs to be broken past by bears in a strong consolidation of negative moves. 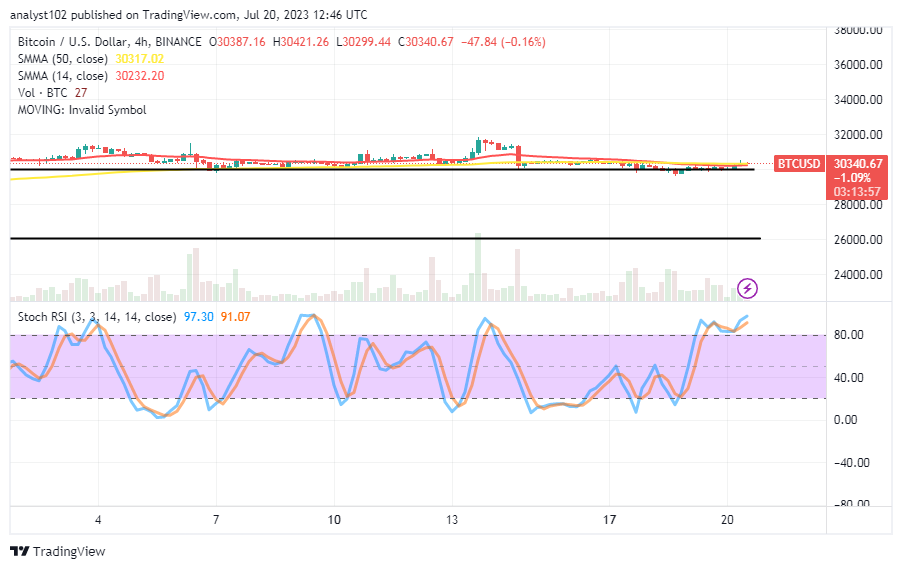
BTC/USD 4-hour Chart
The BTC/USD 4-hour chart shows the crypto-economic trade is holding a base at $30,000, garnering a catalyst around the smaller indicators’ values.
The points of $30,232.30 and $30,317.02 are in close proximity to the 14-day SMA trend line and the 50-day SMA trend line. They are pointing at the waves that are moving east. In order to maintain a slight northward movement between 91.07 and 97.30, the stochastic oscillators have fallen into the overbought area. However, there have been indications that a reduction may be in effect.
Note: Cryptosignals.org is not a financial advisor. Do your research before investing your funds in any financial asset or presented product or event. We are not responsible for your investing results.
You can purchase Lucky Block here. Buy LBLOCK