Ripple (XRP) Is In A Downtrend, Fluctuates Between $1.20 and $1.40
Estimated Reading Time: 2 minutes
Don’t invest unless you’re prepared to lose all the money you invest. This is a high-risk investment and you are unlikely to be protected if something goes wrong. Take 2 minutes to learn more

Ripple (XRP) Long-Term Analysis: Bearish
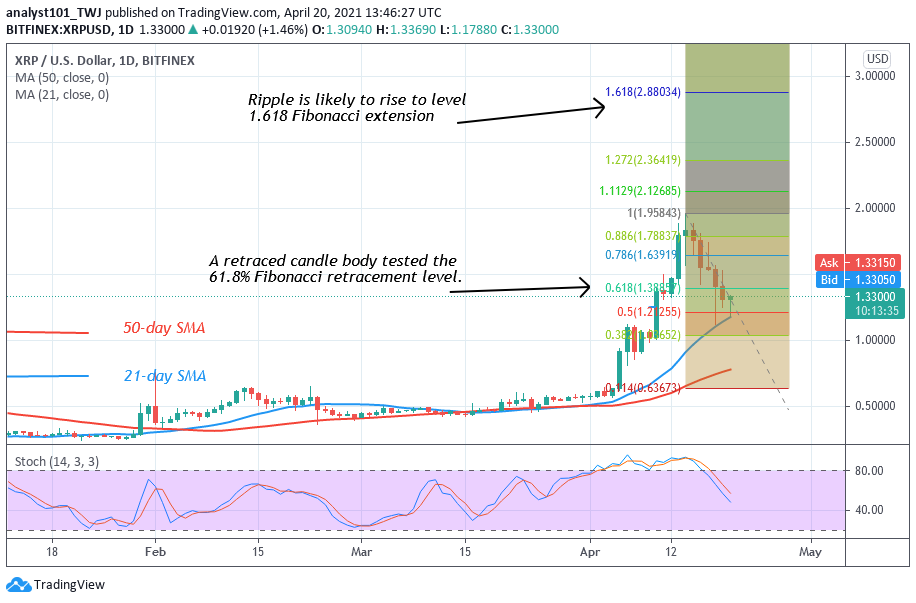
On the daily chart, XRP fell from the high of $1.96 to the low of $1.20. The last bullish candlestick has a long tail that is pointing downward. The long tail indicates there is strong buying pressure at a lower price level. Meanwhile, on April 14 uptrend; a retraced candle body tested the 61.8% Fibonacci retracement level. The retracement indicates that XRP will rise to level 1.618 or $2.87 high.
Ripple (XRP) Indicator Analysis
Ripple is at level 58 of the Relative Strength Index period 14. It indicates that XRP is in an uptrend zone and capable of rising on the upside. The 21-day SMA and the 50-day SMA are sloping up indicating the uptrend.
Technical indicators:
Major Resistance Levels – $0.90, $0.95, $1.10
Major Support Levels – $0.50, $0.45, $0.40
What Is the Next Direction for Ripple (XRP)?
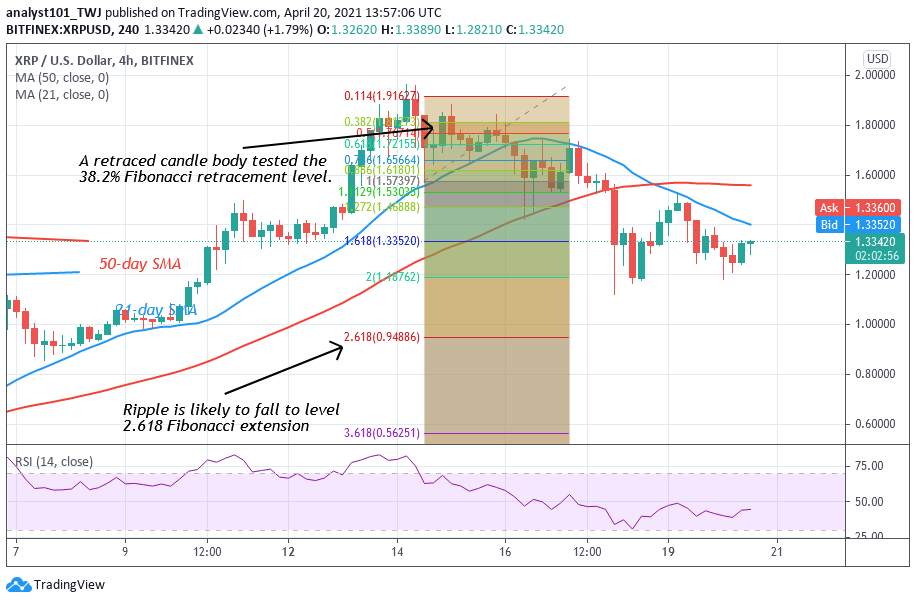
Presently, Ripple is in a downward move. The altcoin is in a downward correction and it is fluctuating between levels $1.20 and $1.50. The uptrend will resume if the current support holds. On the 4 hour chart, a retraced candle body tested the 38.2% Fibonacci retracement level on April 14. This retracement implies that XRP will fall to level 2.618 Fibonacci extensions or the low of $0.94.
Note: cryptosignals.org is not a financial advisor. Do your research before investing your funds in any financial asset or presented product or event. We are not responsible for your investing results