Bitcoin (BTC/USD) Market Signals Bearish Continuation
Estimated Reading Time: 3 minutes
Don’t invest unless you’re prepared to lose all the money you invest. This is a high-risk investment and you are unlikely to be protected if something goes wrong. Take 2 minutes to learn more

Bitcoin Price Prediction – August 8
BTCUSD market signals a bearish continuation with downside targets below $50520. Following the conclusion of the ongoing upward retracement, the bearish trend might resume at the premium zone.
The price has dropped below the 9-day Simple Moving Average (SMA) of $60260, confirming the downward trend. Additionally, the Relative Strength Index (RSI) is hovering at 33.44, signaling that the market is approaching oversold conditions. This indicates potential short-term relief or a minor retracement before the bearish trend continues.
BTC/USD Market Key Levels:
Resistance Levels: $65520, $73840, $80000
Support Levels: $56500, $50510, $49050
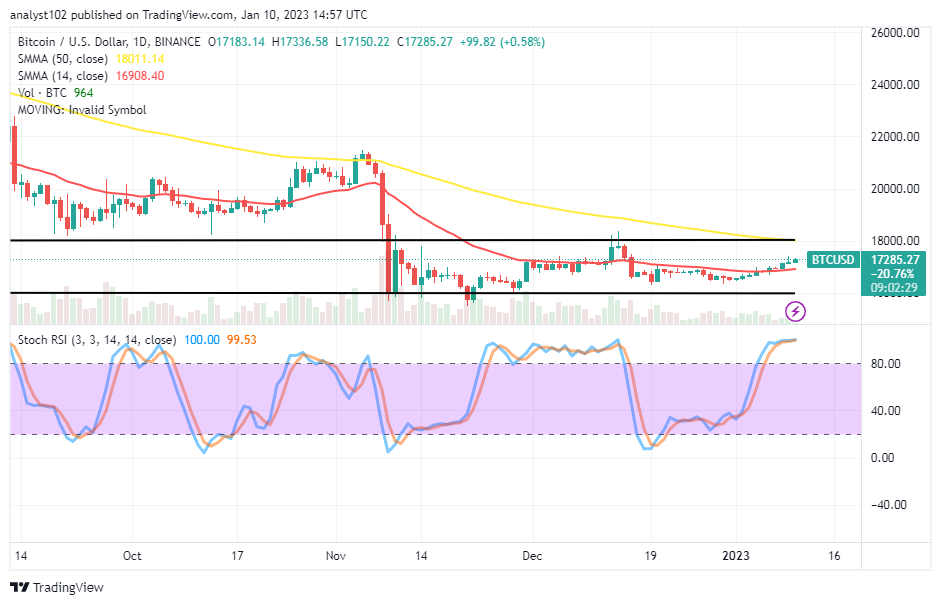
BTC/USD – Daily Chart
The BTCUSD daily chart signals a bearish continuation with downside targets below $50520.
BTCUSD has broken below the 0.786 Fibonacci retracement level, which was around $62000 and is now hovering near the $56500 support zone. The price action shows a strong bearish move that began after the pair failed to sustain above the $70000 level. The recent price action suggests continuing the bearish trend, especially since the price was unable to reclaim the $65520 resistance level.

What are the potential price targets for BTCUSD shortly?
Looking ahead, the projection suggests a potential short-term retracement to around $62410 followed by further bearish movement toward the $50510 support level. If this support level fails to hold, BTCUSD could experience a deeper decline, potentially targeting even lower levels in the coming weeks. The overall outlook remains bearish unless there is a significant shift in market sentiment or a decisive break above key resistance levels.

BTC/USD – Four-Hour Chart
The BTCUSD four-hour chart shows a recent sharp decline after failing to sustain above the $65520 resistance zone. The price is currently recovering, testing the $59510 level, but faces resistance around the $62410 area. The RSI is showing a bullish divergence, indicating the possibility of continuing upward at least into the bearish order block in the premium zone.
Bitcoin (BTC) Current Statistics
The current price: $59510
Market Capitalization: $1,170,000,000,000
Trading Volume: $41,290,000,000
You can purchase Bitcoin here. Buy BTC