Bitcoin (BTCUSD) Market Reverses Downward As Price Hits Major Trendline
Estimated Reading Time: 3 minutes
Don’t invest unless you’re prepared to lose all the money you invest. This is a high-risk investment and you are unlikely to be protected if something goes wrong. Take 2 minutes to learn more

Bitcoin Price Prediction – August 1
BTC/USD market reverses downward as price hits major trendline. Owing to the previous price actions around the major trendline, a change to a bearish move is likely to ensue.
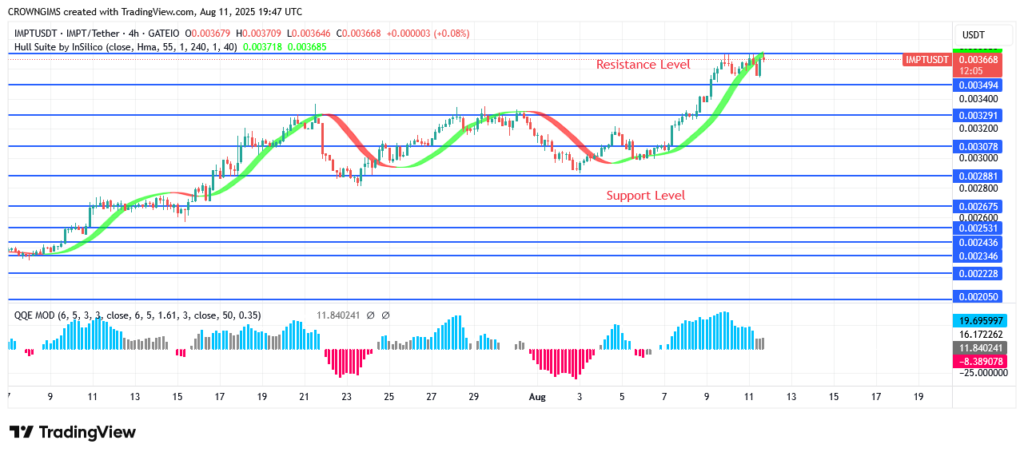
The BTCUSD pair currently shows a bearish trend, as evidenced by the indicators on the chart. The Relative Strength Index (RSI) is at 54.97, indicating a neutral zone but leaning towards a bearish sentiment. The Simple Moving Average (SMA) of 9 periods, displayed at $66690, is above the current price, signaling a potential downturn. This is often seen as a sign that the market could experience further declines as the price tends to revert to the mean or lower levels.
BTCUSD Market Key Levels:
Resistance levels: $65520, $73840, $80000
Support levels: $60000, $56500, $50510
BTCUSD – Daily Chart
The BTCUSD daily chart shows that the market has reversed downward as the price hits a major trendline.
The chart demonstrates a series of lower highs and lower lows, which is a classic sign of a bearish market. After reaching a peak at around $73840, the price has been consistently crashing, struggling to break through the descending trend line.
The most recent price action shows a rejection at the SMA level and a decline towards the $65520. This failure to sustain higher levels further supports the bearish outlook. Additionally, the Fair Value Gap (FVG) near the $62000 mark indicates an area where the price might find temporary support before potentially heading lower.

What are the potential price targets for BTCUSD in the near future?
Based on the current indicators and price action, the projection for BTCUSD remains bearish. The price is expected to test the support level at $60000 and possibly break below it. If the FVG fails to hold price upward, the price could continue its downward trajectory, targeting the $56500 support.

BTC/USD – Four-Hour Chart
The BTCUSD pair is currently exhibiting a bearish trend on the four-hour chart. The bearish trend is further supported by the price trading below the SMA (9) at $66240.
The RSI is at 40.89, which is in bearish territory, suggesting potential further downside. The overall price action shows a series of lower highs, reinforcing the bearish sentiment.
Bitcoin (BTC) Current Statistics
The current price: $66080
Market Capitalization: $1,240,000,000,000
Trading Volume: $37,620,000,000
You can purchase Bitcoin here. Buy BTC