Tamadoge (TAMA/USD) Demonstrates Resilience at $0.0086, Assessing Potential for a Price Rally
Estimated Reading Time: 3 minutes
Don’t invest unless you’re prepared to lose all the money you invest. This is a high-risk investment and you are unlikely to be protected if something goes wrong. Take 2 minutes to learn more
Examine the Tamadoge market through the daily chart spanning August to September. During this period, the market’s bandwidth, representing the difference between support and resistance, fluctuated between $0.006 and $0.0150. In early October, the price channel converged with a notably reduced bandwidth, indicating a state of indecision within the market. Nonetheless, amidst the consolidation trend characterized by horizontal movement, there has been a noteworthy occurrence of upward (bullish) spikes.
Notably, the market is exhibiting more upswings, particularly around the $0.0083 price level, than downswings. This observation can be construed as a bullish signal, suggesting that despite prevailing indecision, traders continue to express a greater inclination towards buying rather than selling the market.
Key Levels
- Resistance: $0.013, $0.014, and $0.015.
- Support: $0.0075, $0.0073, and $0.007.
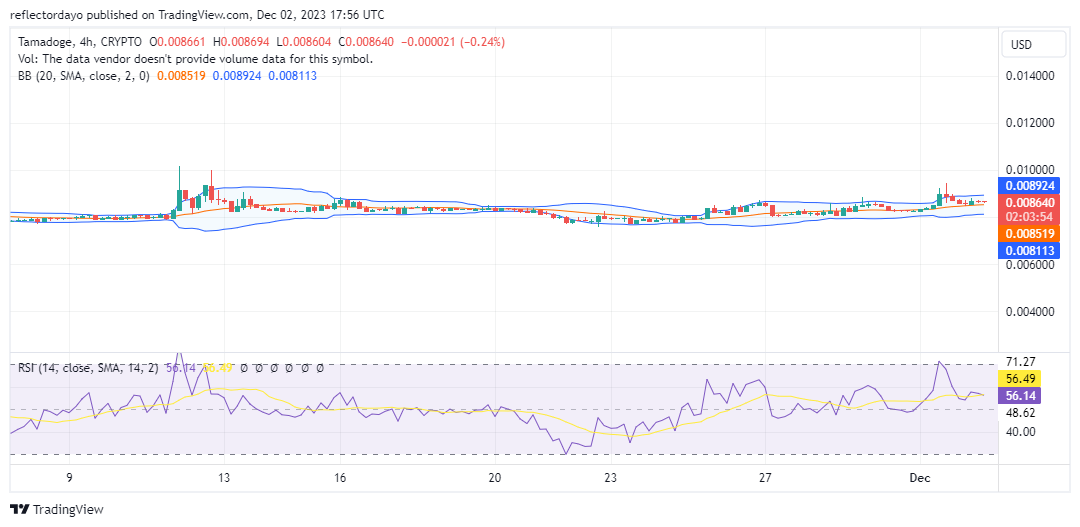
TAMAUSD Price Analysis: The Indicators’ Point of View
A greater number of price swings in the upward direction have been observed around the $0.0083 level compared to the downward direction. This indicates a prevailing bullish sentiment among Tamadoge traders, although the bullish market appears constrained within a narrow, ranging price channel. The market’s condition, as depicted by the Relative Strength Index (RSI), favors the bulls, as the RSI line consistently registers above the 50 level. This signifies that the advantage remains with the bulls over the bears.
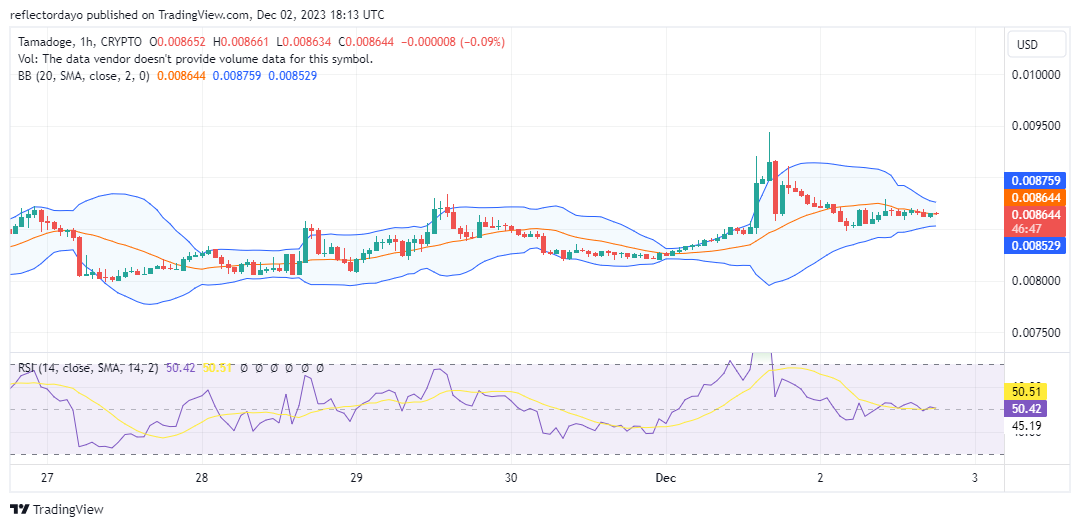
Tamadoge Short-Term Outlook: 1-Hour Chart
The shorter timeframe signals an impending price breakout, likely in a bullish direction. With the bulls maintaining $0.0085 as the support level, the Bollinger Bands indicator reveals a convergence of its bands around the price action. Notably, price actions are exhibiting increasing flatness around $0.00865. The Relative Strength Index (RSI) corroborates this trend, positioning the market within the midpoint of the indicator, indicative of a volatility squeeze typically preceding a robust market movement. The next anticipated level for the market is approximately $0.0095.
With Tamadogi, begin your awesome journey and begin earning $TAMA rewards right now.
Welcome to the Tamaverse 🐶
Get started on your pawesome journey with Tamadogi and start earning $TAMA rewards today 👇
📱 Android: https://t.co/RfZIZOLIDh
📱 iOS: https://t.co/du3iRej7HC pic.twitter.com/NrKLNC3u5j— TAMADOGE (@Tamadogecoin) December 1, 2023
Do you want a coin that will be 100 times more valuable in the next few months? That is Tamadoge. Buy TAMA today!