Tamadoge (TAMA/USD) Buyers Striving to Propel Market Beyond $0.0085
Estimated Reading Time: 3 minutes
Don’t invest unless you’re prepared to lose all the money you invest. This is a high-risk investment and you are unlikely to be protected if something goes wrong. Take 2 minutes to learn more

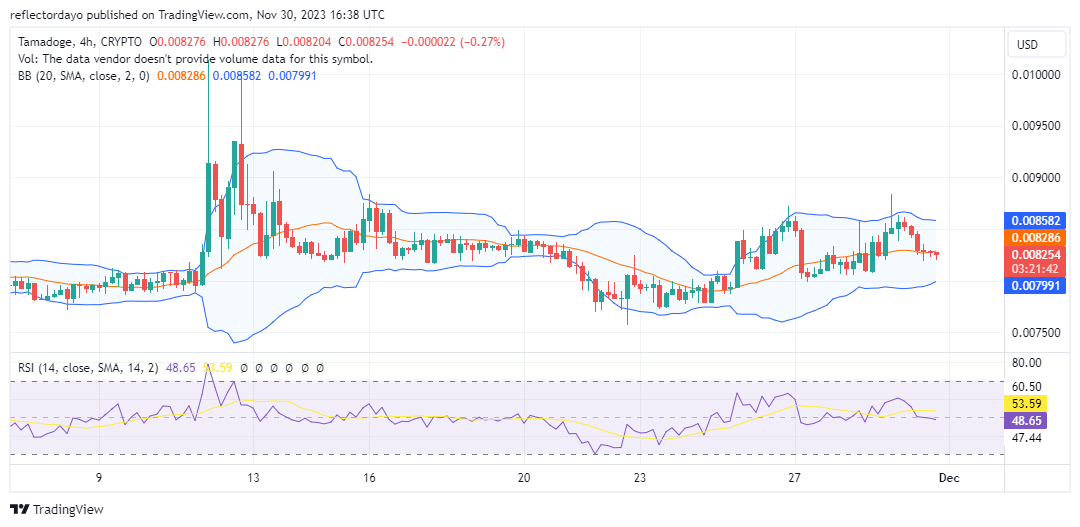
Sellers of TAMA/USD initiated a downward trend in the market on November 20. However, buyers promptly intervened on November 21, establishing a robust pivot around the $0.007744 price level, successfully reversing the market’s trajectory. Despite a robust bullish surge at the $0.0085 price level, the sustained bullish momentum proved challenging, succumbing to intensified bearish pressure. Notably, buyers managed to reclaim the $0.008 price level, establishing it as a newfound support level in the current market dynamics.
Key Levels
- Resistance: $0.013, $0.014, and $0.015.
- Support: $0.0075, $0.0073, and $0.007.
TAMA/USD Price Analysis: The Indicators’ Point of View
Commencing at the pivotal $0.008 price level, the market underwent a retesting phase at $0.0085. However, sustaining the upward movement beyond $0.0085 proved elusive, leading to a resurgence of the bear market. Notably, the emergence of a long-legged doji pattern around $0.00825 suggests the potential development of a new support level at this juncture. This prospective support level holds significance as a higher pivot, indicating a strategic position that could bolster the resilience of the bull market. As this support aligns in proximity to the critical $0.0085 price level, the anticipation of a breakthrough intensifies, placing increased pressure on the resistance level to yield to the prevailing TAMA/USD bullish momentum.
Tamadoge Short-Term Outlook: 1-Hour Chart
In the 4-hour chart analysis of the TAMA/USD market, the price action appears to consolidate around the midpoint of the Relative Strength Index, suggesting an equilibrium market condition. This observation raises the possibility of a forthcoming support level materializing at the $0.00825 price point.
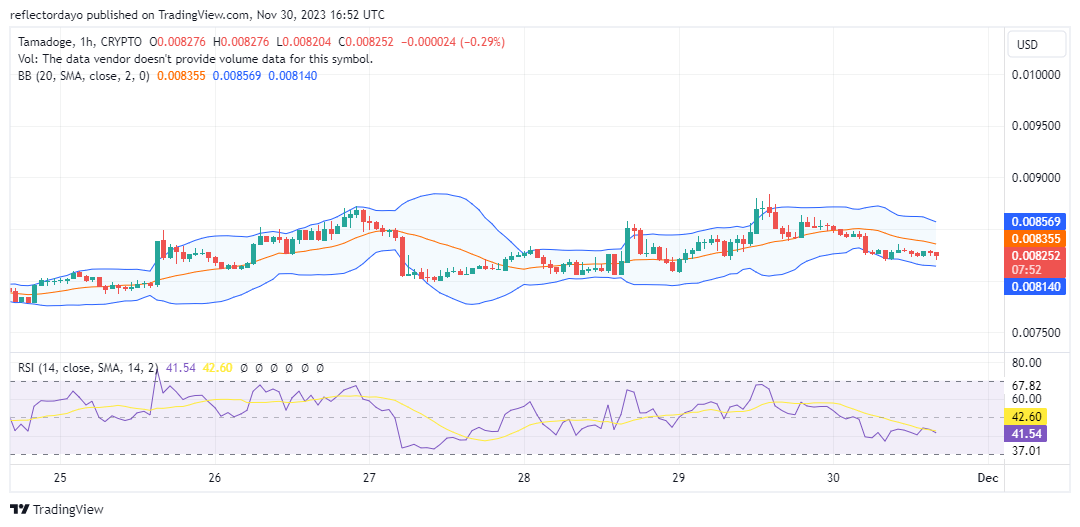
Conversely, the 1-hour chart indicates that the price is below the 20-day moving average, and the Relative Strength Index registers at 41.54, indicating a moderate level of market momentum. Despite the apparent strength of bears in the 1-hour timeframe, a recent candlestick formation, specifically a hammer, signals bullish sentiment. This suggests that the bulls retain strength, and there is potential for a price rally from this point onward.
It’s at hand! We’re happy to announce that Tamadogi, our newest game, is now playable on iOS and Android!
It’s here! We’re pleased to announce our latest game Tamadogi is available to download on Android & iOS!
Download now to look after your own Tamadoge 👇
📱 Android: https://t.co/RfZIZOLaNJ
📱 iOS: https://t.co/du3iReizS4 pic.twitter.com/LfFP7RIVPQ— TAMADOGE (@Tamadogecoin) November 30, 2023
Do you want a coin that will be 100 times more valuable in the next few months? That is Tamadoge. Buy TAMA today!